Feature Debugging
Feature Debugging is a tool that allows individual features to be inspected during a translation. It differs from inspecting data at a particular location in that it inspects features one at a time, and allows the author to trace that feature's progress through a workspace.
This is most useful when a problem has been identified as being during transformation, but the point of failure is unknown.
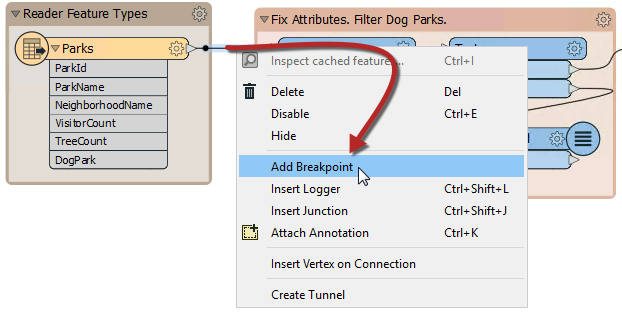
Feature Debugging is triggered by "breakpoints"; workspace connections that are flagged by the user as a location where features should be inspected:
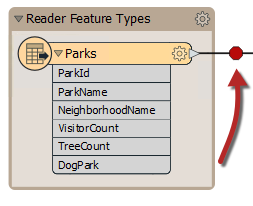
The connection is highlighted in a darker black color with a red "stop" sign, to denote its new status:
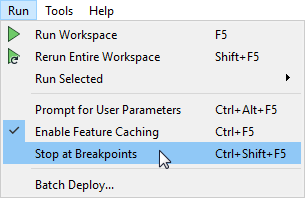
Now the turn the “Stop at Breakpoints” on Run > Stop at Breakpoints and then run the translation:
When the first feature arrives at the breakpoint, the translation is temporarily paused and information about the feature displayed in a Feature Inspector window.
The upper section of the window shows a graphic representation of the feature; the lower section lists properties such as Feature Type and Coordinate System; plus attribute and geometry information.
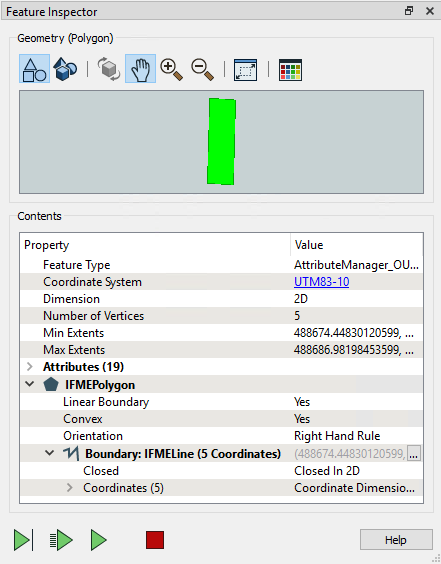
There are four buttons at the foot of the Feature Inspector window:
| Button | Operation | Description |
|---|---|---|
 |
Step to Next Connection | This tool steps through the workspace one feature at a time, showing the status of a feature as it is processed. |
 |
Step to Next Breakpoint | This tool re-starts the translation, stopping the next time a feature reaches an inspection point. |
 |
Continue Translation | This tool re-starts the translation, ignoring all further breakpoints. |
 |
Stop Translation | This tool stops the translation. |
The currently active connection is highlighted red to show it is the location where the translation is currently paused.