Imager
Table of Contents
Overview
The Imager allows you to adjust the stereo width of your mix using multiband stereo imaging. The Imager module interface is divided into four main sections:

Module Header
The Imager module header includes the following controls:
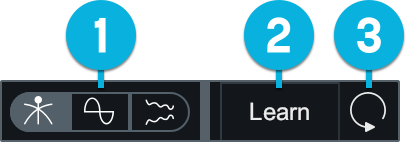
- View Selector: See the Views section below for detailed descriptions of the different meter views.
- Learn: Enables automatic crossover point placement. When active, crossover points will be moved to minima detected in the frequency spectrum of your track. When crossovers have been set to their ideal frequency values, Learn will automatically disable itself. Note: Learn is not available in single band processing mode.
- Reset: Returns all module controls to their default values.
Views
You can toggle between the different Imager views using the view selector buttons in the module header area.

The Imager module includes the following views:
Crossover Spectrum
All multiband modules in Ozone support up to four processing bands. All multiband capable modules are single band by default. You can create new processing bands and manage multiband crossovers in the Crossover Spectrum view. Note: crossover cutoff frequencies are not shared or linked across multiband modules in the main Ozone plug-in.
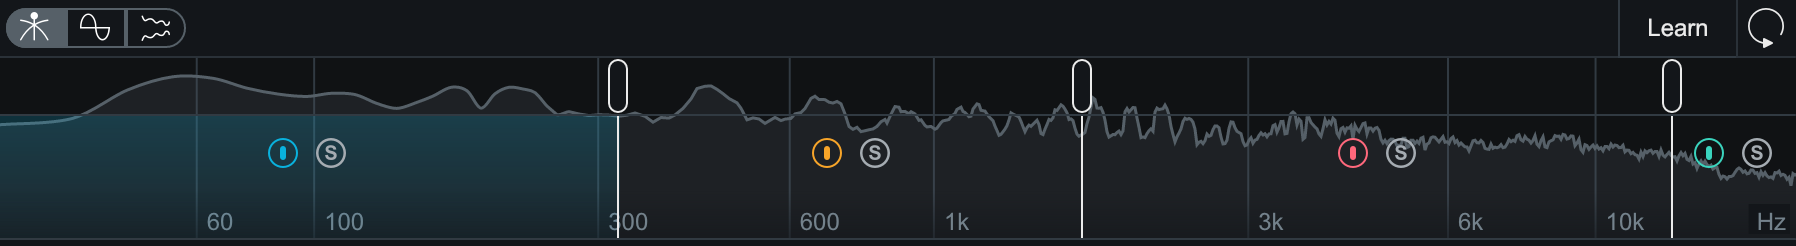
Adjusting Crossovers
- Add band: Hover your cursor over the crossover spectrum view and click the + button to add a new crossover point.
- Enable/disable band: Click the power button to enable/disable processing in the associated band.
- Solo band: Click the S button to isolate playback of the associated band.
- Remove band: Hover over a band in the crossover view and click the x that appears to remove the band.
- Adjust crossover cutoffs: Click and drag a handle to adjust the crossover frequency. You can also double-click on a crossover handle and enter the value manually in the inline edit field that appears.
Correlation Trace
Draws stereo correlation values over time. Negative correlation (out of phase) values are drawn in red; positive correlation (in phase) values are drawn in white.
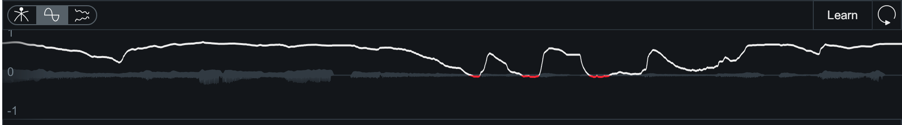
The correlation trace displays information based on the output signal of Ozone, so adjustments to the Imager controls are reflected in this meter.
Stereo Width Spectrum
Displays a hybrid mirrored spectrum analyzer of the signal’s stereo width.
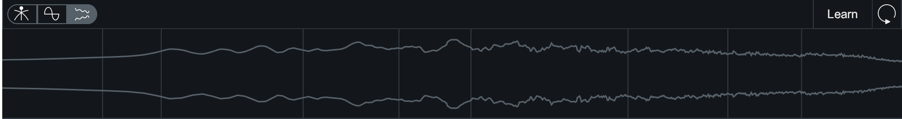
When the signal is fully mono, only a straight line will be drawn in the center of this view.
Controls
The Imager module includes the following controls:

Width
Adjusts the amount of gain applied to side channel content. Positive values will increase perceived stereo width, and negative values will decrease the perceived stereo width of a band. A setting of -100 will make the output of the associated band effectively mono.
Note
If the input signal to the Imager is either: mono (i.e. single channel) or effectively mono (i.e. a stereo file with the same content on both channels), you will need to enable the Stereoize feature for Width adjustments to have an effect on the signal.
Link Bands
Enable to link Width controls adjustments across all bands. When enabled and a Width control is adjusted for one band, all other Width controls will be adjusted by the same amount.
Stereoize
Stereoize processing is applied to all processing bands equally. The following controls allow you to enable the effect and adjust the associated settings.
- Stereoize power button: Enables/disables stereoize processing.
- Stereoize Amount: Adjust the slider to add natural-sounding stereo width to narrow recordings and to
control the character of the stereo effect in conjunction with the width sliders.
Stereoize is Mono Compatible
The Stereoize effect is completely mono compatible. Even if you add width to audio, it can still be played back in mono without producing unpleasant artifacts.
- Stereoize Modes: There are two different stereoize processing modes available in the Imager:
- Mode I: Haas Effect-based decorrelation processing. This mode creates a delayed copy of the mid channel signal and injects it into the side channel.
- Mode II: A newly developed alternative to the classic stereoize mode. This new mode has a slightly different tonal quality from the original and helps to preserve transients at higher settings.
Vectorscope
The vectorscope meters provide a view of the stereo image of the signal after all other processing is applied, regardless of the Imager’s position in the signal chain.
Polar Sample
Plots dots per sample on a polar coordinate display to highlight the stereo image of the incoming signal.
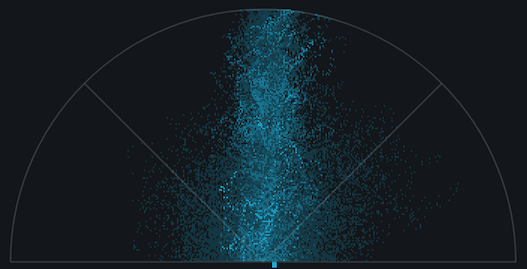
Patterns that appear within the 45-degree safe lines represent in-phase audio. Patterns outside these lines represent out-of-phase audio. The history of the Polar Sample Vectorscope fades out slowly. You can reset the display by clicking on the meter.
Polar Level
Plots rays on a polar coordinate display that represent sample averages and displays the stereo energy of a recording.
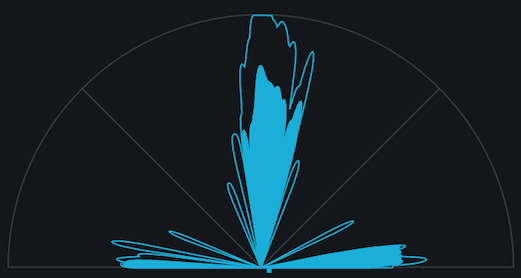
The length of the rays represents amplitude. The angle of the rays represents their position in the stereo image. Rays within the 45-degree safe lines represent in-phase audio. Rays beyond the safe lines represents out-of-phase audio.
Lissajous
Plots per-sample dots on a traditional oscilloscope display similar to the Polar Sample vectorscope.
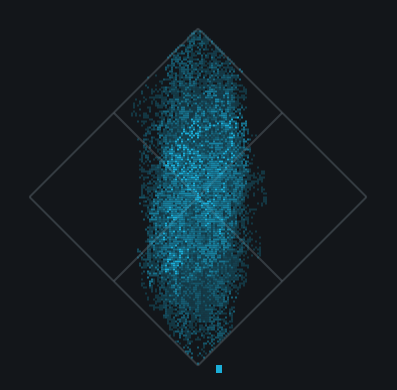
Typically, stereo recordings produce a random pattern on a Lissajous Vectorscope that is taller than it is wide. Vertical patterns mean left and right channels are similar (approaching mono). Horizontal patterns mean the two channels are very different, which could result in mono compatibility problems.
Clipping in the Vectorscope
Clipped samples are drawn in red along the edges of the vectorscope meter frame. Click on the meter to reset the clipped samples display.
Correlation Meter Bar
The vertical bar meter to the right of the vectorscope indicates the degree of similarity (or correlation) between the left and right channels.
Tips
- If the left and right channels are exactly the same, the correlation value would be +1 and the meter tick would be drawn at the top.
- If the left and right channels are exactly out-of-phase the correlation would be -1 and the meter tick would be drawn all the way at the bottom.
- In general, most recordings have phase correlations in the 0 to +1 range. A brief readout towards the bottom half of the meter is not necessarily a problem but could represent a possible mono compatibility issue.
- As you increase stereo widening, the phase correlation will tend to draw more towards the bottom half of the meter, as the left and right channels will become “wider” and less similar.
Stereo Balance Meter
The horizontal bar meter directly below the vectorscope meter indicates the stereo balance of the signal. When the meter tick is drawn all the way to the left, it indicates there is only information on the left channel. When the meter tick is drawn all the way to the right, it indicates that there is only information on the right channel.