Dynamics
Table of Contents
Overview
You can use this module to shape the dynamics of your mix, with up to four bands of analog-modeled compression and limiting.

Module Header
The module header includes the following controls:

- View Selector: See the Views section below for detailed descriptions of the different meter views.
- Channel Processing Modes: Selects the channel processing mode used by Dynamics.
- Dynamics supports Stereo and Mid/Side mode.
- See the General Controls chapter for more information.
- Learn: Enables automatic crossover point placement. When active, crossover points will be moved to minima detected in the frequency spectrum of your track. When crossovers have been set to their ideal frequency values, Learn will automatically disable itself. Note: Learn is not available in single band processing mode.
- Reset: Returns all module controls to their default values.
Views
You can toggle between the different views using the view selector buttons:

The Dynamics module includes the following views:
Crossover Spectrum
All multiband modules in Ozone support up to four processing bands. All multiband capable modules are single band by default. You can create new processing bands and manage multiband crossovers in the Crossover Spectrum view. Note: crossover cutoff frequencies are not shared or linked across multiband modules.

Dynamics Gain Reduction/Increase in Crossover
The horizontal lines drawn in band colors display gain reduction/addition occuring in the associated processing band. This is only shown in the Dynamics module crossover view.
Adjusting crossovers
- Add band: Hover your cursor over the crossover spectrum view and click the + button to add a new crossover point.
- Enable/disable band: Click the power button to enable/disable processing in the associated band.
- Solo band: Click the S button to isolate playback of the associated band.
- Remove band: Hover over a band in the crossover view and click the x that appears to remove the band.
- Adjust crossover cutoffs: Click and drag a handle to adjust the crossover frequency. You can also double-click on a crossover handle and enter the value manually in the inline edit field that appears.
Gain Reduction Trace
Displays a scrolling waveform with a superimposed trace reflecting the amount of gain reduction applied over time.
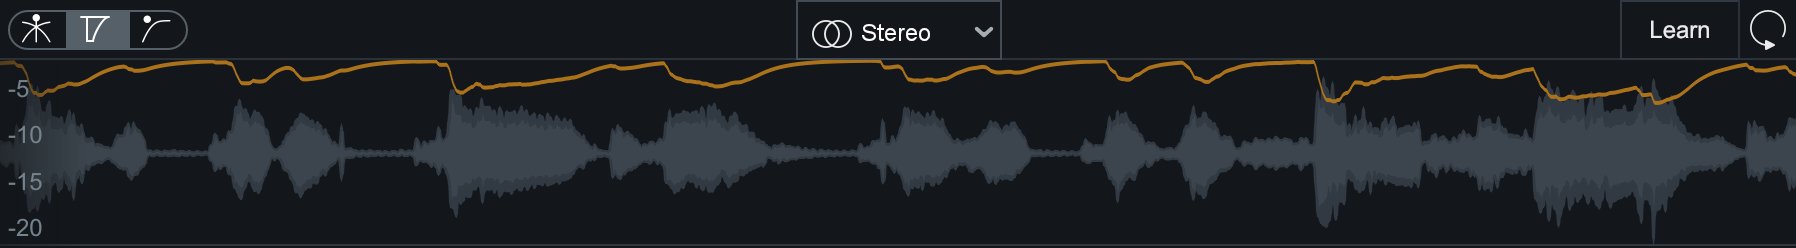
Gain Reduction in Multiband
The gain reduction trace shows information for one band at a time. The trace color matches the color of the band it is metering.
Detection Filter
This view includes a spectrum analyzer and detection input filter controls. The detection filter allows you to apply a filter to the signal used by the level detector to trigger dynamics processing.
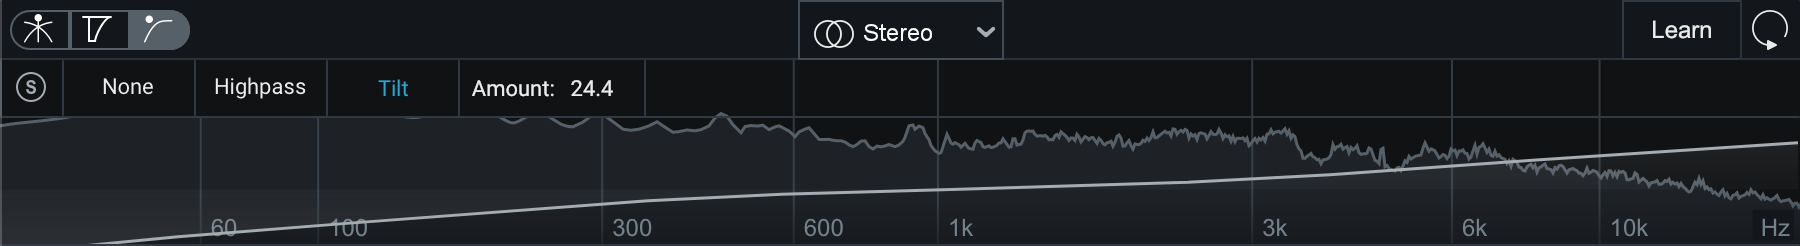
The following controls are available in the Detection Filter view:
- None: Disables the detection input filter. This is the default setting.
- Highpass: Enables a highpass filter. You can adjust filter slope by clicking the filter node and dragging the node handles horizontally.
- Tilt: Similar to the THRUST circuit found on API compressors, Tilt mode preserves low frequencies using
a high-frequency weighted filter curve.
- Amount: Controls the Tilt filter slope. Adjust Amount by clicking and dragging over the readout or by double-clicking on the readout and entering a new value in the inline edit field.
- Solo: Isolates playback of the detection input signal after filtering.
Band Control Views
There are two different views for band controls in the Dynamics module panel:
You can toggle between these views using the Band View Selectors located on the right side of the Dynamics module controls panel.
Selected Band View
Provides a focused view of the selected processing band. This is the default band view selection.

You can change which band is displayed using the following methods:
- Band View Selector arrows: Click the arrow buttons to the left/right of the Band View button to switch between band views.
- Select band in Crossover Spectrum: Click on a band region in the Crossover Spectrum to show the associated controls in the Selected Band View.
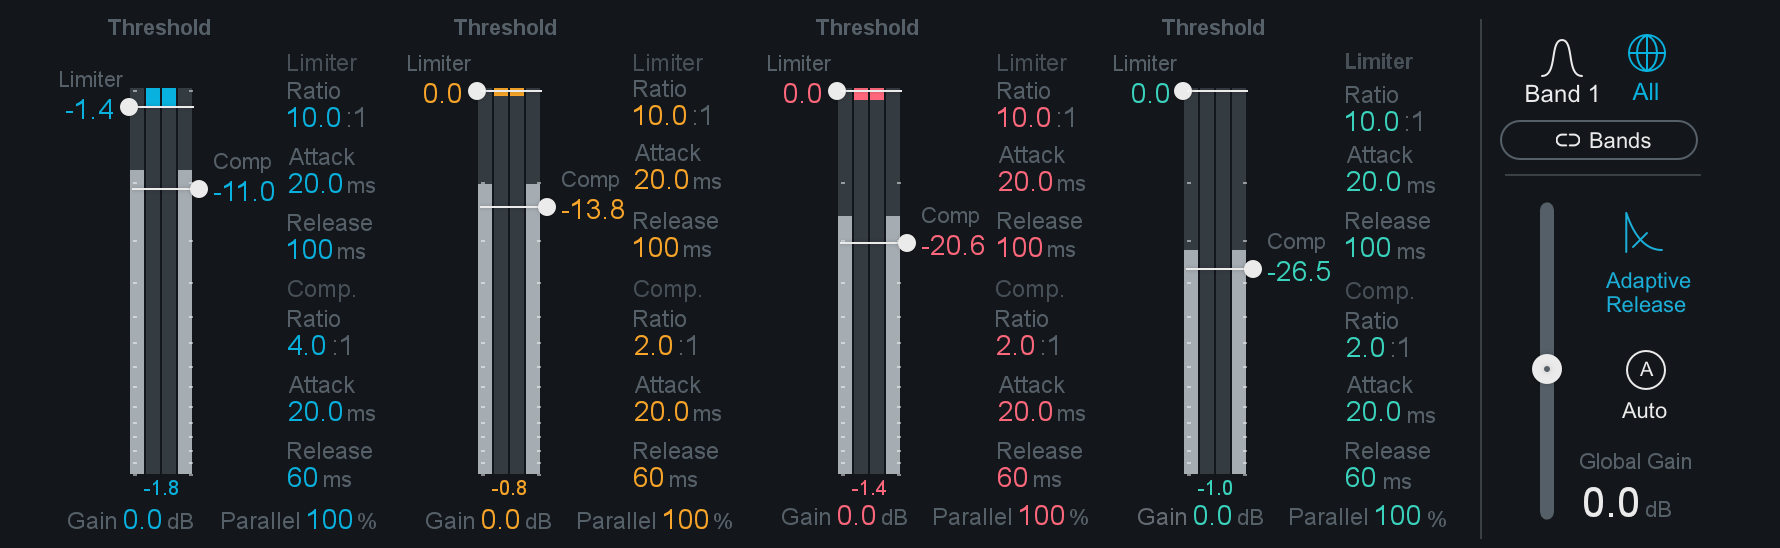
All Bands View
This view offers a consolidated overview of key controls for all four bands. If a band is inactive, the controls will appear greyed out in this view.
Not accessible in All Bands View
The Knee (Limiter/Compressor) control, global Level Detection Mode, and the Dynamics Curve Meter are hidden from the All Bands View, switch to the Selected Band View to access these features.
Controls and Meters
The following sections outline the controls and meters included in the Dynamics module.

- Level Detection Mode
- Threshold
- Ratio
- Attack
- Release
- Knee
- Parallel
- Dynamics Curve Meter
- Band View Selectors
- Link Bands
- Global and Band Gain
- Auto Gain
- Adaptive Release
Level Detection Mode
Determines how the input signal level is measured by the Dynamics level detection circuit. This is a global setting, shared by all bands in multiband mode.

- Peak: Uses the peak level of the incoming signal. In general, this setting is useful when you are trying to even out sudden peaks in your music.
- Env: (Envelope) Uses the average level of the incoming signal evened out across the frequency spectrum. Similar to RMS mode but with some advantages. Unlike RMS, Envelope mode produces even levels across all frequencies and will not produce the aliasing or artifacts that RMS detection can cause.
- RMS: Uses the average level of the incoming signal. RMS detection is useful when you are trying to increase overall level without changing the character of the sound.
Threshold
Determines the signal level at which the compressor or limiter begins processing. The handle on the left controls the Limiter Threshold, the handle on the right controls the Compressor Threshold.

Threshold Input Meter
Displays the input level to the level detection circuit (outer meters, displayed in grey) alongside the gain change applied as a result of the dynamics processing (inner meters, displayed in the corresponding band color).
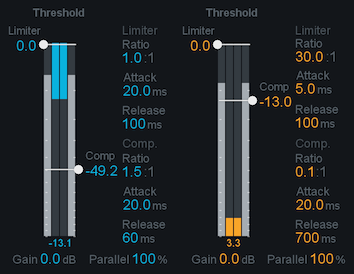
Gain reduction is drawn from the top to the bottom of the meter, gain increase is drawn from the bottom to the top of the meter.
Ratio
Determines the amount of gain reduction applied to a signal when the threshold is crossed.
Compressor Ratios
- Compressor Ratio Default: 2:1.
- Compressor Ratio Range: (10):1 to 30:1. Note: (10):1 is shown as 0.1:1 in All Bands View.
- Positive Compressor ratios result in downward compression. Downward compression reduces the level of signals that reach the threshold and leaves signals below the threshold unaffected.
- Negative Compressor ratios result in upward compression. Upward compression raises the level of signals that fall below the threshold and leaves signals above the threshold unaffected. Upward compression can gently raise levels instead of pushing down peaks.
Limiter Ratios
- Limiter Ratio Default: 10:1.
- Limiter Ratio Range: (2.5):1 to 30:1. Note: (2.5):1 is shown as 0.4:1 in All Bands View.
- Positive Limiter ratios result in downward compression (limiting). Higher ratios, particularly 10:1 or
greater, result in limiting (more extreme downward compression).
Limiter behavior at maximum Ratio setting
The Limiter in the Dynamics module is similar to the response of a limiter in the analog domain. When the Dynamics Limiter Ratio is set to 30:1, some overshoot may still occur because it does not function as a Brickwall limiter.
- Negative Limiter ratios result in upward expansion. Upward expansion raises the level of signals that exceed the threshold. Upward expansion can be used to add punch to dull mixes or emphasize the beat in rhythm-heavy music.
Attack
Determines the amount of time, or how quickly it takes (in milliseconds), for the dynamics to react and for the signal to become fully compressed after exceeding the threshold level.
Release
Adjusts the amount of time (milliseconds) it takes for the dynamics processor to return to unity gain (recovers gain) when the input signal falls below the threshold.
Knee
Adjusts a range around the threshold that determines how abruptly processing is applied to a signal as it approaches the threshold.
- Higher values create a “soft knee” effect, which gradually introduces processing as the signal approaches the Threshold level. This provides subtler, more natural sounding compression.
- Lower values create a “hard knee” effect, which abruptly begins processing when the signal crosses the Threshold level. This offers more aggressive sounding compression and is often used on individual tracks, such as kick or snare drum.
Parallel
Adjusts the amount of the “dry” (unprocessed) signal to mix with the “wet” (processed) signal. This technique is also known as “parallel compression”. This control is available for each band individually.
Dynamics Curve Meter
The Dynamics Curve Meter is an interactive plot of the Threshold, Ratio, and Knee controls as they relate to input and output levels. The y-axis represents output level (dB) and the x-axis represents input level (dB). You can zoom in/out by clicking the +/- buttons that appear in the bottom right when hovering your cursor over the meter. Signal activity is drawn below the curve in the associated band color.

Dynamics Curve Meter Nodes
- C (Compressor): This node is associated with the Compressor Threshold and Knee. Moving left/right will affect Compressor Threshold. Adjusting the node handles will affect Compressor Knee.
- L (Limiter): This node is associated with the Limiter Threshold, Limiter Knee, and Compressor Ratio. Moving left/right will affect Limiter Threshold. Adjusting the node handles will affect Limiter Knee. Moving up/down will affect Compressor Ratio (positive Ratios only).
- Leftmost and Rightmost nodes: These nodes indicate the amount of gain reduction/increase applied to signals above/below the threshold.
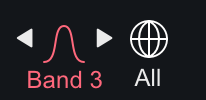
Band View Selectors
Switch between Selected Band View or All Bands View.
Use the arrow buttons to the left and right of the Band # button to switch between available band views.
Link Bands
When enabled, all band specific control adjustments will be linked relative to their current settings.
Global and Band Gain
Adjusts gain after Dynamics processing, useful for compensating for level differences caused by Dynamics processing. You can make adjustments to Global Gain and Band Gain simultaneously.
- Band Gain: Adjusts the amount of gain applied to the associated band after Dynamics processing. When working in the Selected Band View, the Gain slider for the currently selected band is located on right side of the Dynamics module controls panel. When working in All Bands View, a Gain control is located directly below the threshold meter for each band.
- Global Gain: Adjusts the amount of gain applied to the output signal of all bands after Dynamics processing. The Global Gain control is located on the right side of the Dynamics module controls panel when All Bands View is selected. The Global Gain slider is hidden when you are working in the Selected Band View.
Auto Gain
When enabled, make-up gain is automatically calculated and applied to the output signal to compensate for level differences introduced by dynamics processing. The automatic gain control calculates the RMS levels of the input and output signals independently for each Dynamics crossover band. Gain is automatically applied to the output signal based on the RMS level difference between the input and output signals. Auto gain and manual global/per-band gain adjustments can be applied simultaneously.
Adaptive Release
When enabled, automatically adjusts the Release time of the Compressor based on the peak factor of a signal.
- If a transient signal is detected, the Release time is scaled to be shorter to reduce pumping.
- If a sustained signal is detected, the Release time is scaled to be longer to reduce distortion.
Auto Release Adjustments
The Release time is scaled in relation to the Release value set by the user. For example: if you are using the Compressor with the Release time set to 100 ms, the Release time will be automatically adjusted to a value within a range of 20 ms to 200 ms, depending on the type of signal that is being processed.