Imager
Overview
Ozone’s Imager module allows you to adjust the stereo width of your mix, using a multiband stereo imaging module. The Imager is also available as a component plug-in of Ozone 8 Advanced.

Controls
Band Width
Sets the amount of stereo widening applied to each band; there is one slider for each of the four bands. Positive values will widen the output of the band, negative values will narrow it (a setting of -100 is effectively mono).
Enable Stereoize
Enable Stereoize to add natural-sounding stereo width to narrow recordings.
Stereoize Amount
By adjusting the amount control in conjunction with the width sliders, you can control the character of the stereo effect. The Stereoize effect is completely mono compatible; even if you add width to audio, it can still be played back in mono without producing unpleasant artifacts.
Link Bands
When enabled, Width controls will be linked across all bands. In this case, when a Width control is adjusted in one band, the Width control will be adjusted by the same amount in all other bands.
Meters
Vectorscope
The Vectorscope provides a view of the stereo image of the signal. Note that it monitors Ozone’s final output, regardless of the Imager’s place in the signal chain. You can check mixes for stereo separation, while using the module’s controls to provide more or less separation. The vectorscope provides three different views, each of which you can select by clicking on the display type label below the scope:
Polar Sample Vectorscope
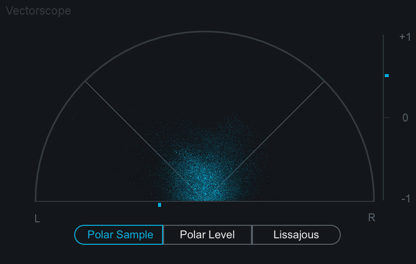
The Polar Sample Vectorscope plots dots per sample, but uses a polar coordinate display that is more useful in highlighting the stereo image of the incoming signal. Patterns that appear within the 45-degree safe lines represent in-phase signals while patterns outside these lines represent out-of-phase audio. The history of the Polar Sample Vectorscope also fades out slowly. The last few seconds are displayed as slowly fading data points. You can reset the display by clicking on the meter.
Polar Level Vectorscope
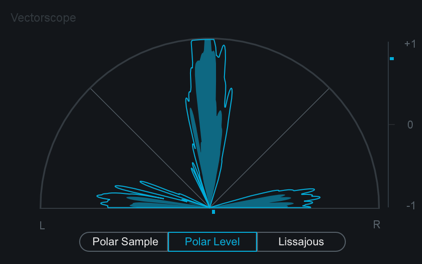
The stereo energy of a recording is clearly represented by the Polar Level Vectorscope, which plots rays on a polar coordinate display that represent sample averages. The length of the rays represents amplitude while the angle of the rays represents their position in the stereo image. Rays within the 45-degree safe lines represent in-phase audio while anything beyond these lines represents audio that is out of phase. History is represented on the Polar Level Vectorscope with the shrinking of the plotted rays slowly over time. The rays shrink towards the center of the vectorscope leaving the outer portion of the display for real-time analysis.
Lissajous Vectorscope
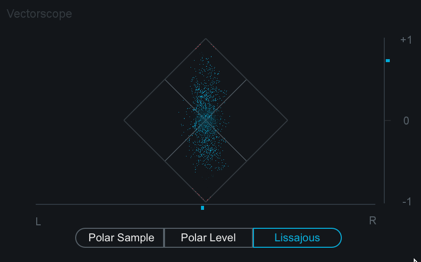
Like the Polar Sample vectorscope, the Lissajous Vectorscope plots per-sample dots on a traditional oscilloscope display. Typically, stereo recordings produce a random pattern on a Lissajous Vectorscope that is taller than it is wide. Vertical patterns mean left and right channels are similar (approaching mono, which is a vertical line). Horizontal patterns mean the two channels are very different, which could result in mono compatibility problems.
Correlation Meter
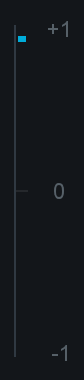
The correlation meter indicates the degree of similarity (or correlation) between the left and right channels, displayed a +1/0/-1 vertical meter. When the audio in the left and right channels is similar, the meter draws towards the top. The extreme case is when the left and right channels are exactly the same, in which case the correlation is +1 and the meter would be positioned all the way at the top. When the left and right channels are different, the meter draws towards the bottom. The extreme case here would be for the left and right to be exactly out of phase, in which case the correlation is -1 and the meter would be positioned all the way at the bottom.
Clipping
- The Vectorscope will draw any clipped samples in red.
- You can double-click on the Vectorscope to clear the meter display.
Notes on the Phase correlation Meter
- In general, most recordings have phase correlations in the 0 to +1 region. A brief readout towards the bottom half of the meter is not necessarily a problem but could represent a possible mono compatibility issue.
- As you apply greater multiband stereo widening to your audio, the phase correlation will tend to draw more towards the bottom half of the meter, as the left and right channels will become “wider” and less similar.
Mini-meter Views
The Imager module offers different mini-meter views above the controls area.
Stereo Width Spectrum
This view shows a hybrid mirrored spectrum display of the signal’s stereo width. This meter is only available in the Imager.
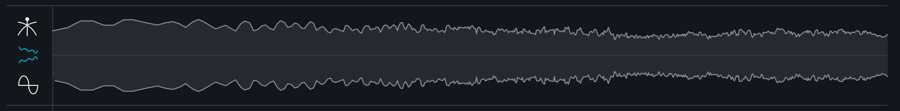
Correlation Trace
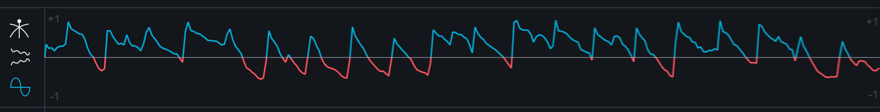
This view displays a scrolling history of the incoming signal’s stereo correlation drawn in real-time. Positive (in phase) values are drawn in light blue while negative (out of phase) values are drawn in red.
Crossover
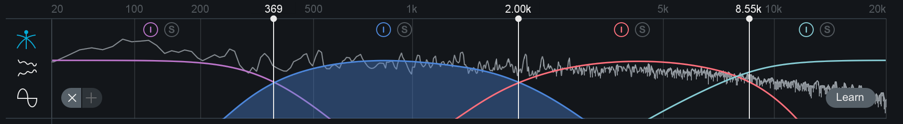
This view displays a spectrum analyzer and multiband crossover controls. For more information about using the crossover view, see the Common Module Controls chapter.