Masking Meter
Table of Contents
Overview
Neutron’s Masking Meter can be used to quickly and easily see where there are tracks competing for space in your mix, potentially contributing to a lack of clarity, a muddy sound, or “masking”.
What is Masking?
By definition, masking is a psychoacoustic phenomenon that occurs when two sounds occupy the same (or similar) frequency ranges and become indistinguishable. When masking appears in a mix, masking can cause your tracks to lose definition and clarity due to multiple sounds fighting for attention in a similar frequency range.
Problem with Masking
Masking can make it difficult to discern audio that needs sonic separation or space. In general, masking can be either encouraged or problematic (but not bad) depending on its context:
- Encouraged masking: when two sources blend there is likely some overlap in a frequency range, and therefore some amount of masking happens. This is similar to the use of distortion in mixing.
- Problematic masking: when two sources blend, but their frequencies tend to obscure rather than compliment each other. This can be frustrating because it is difficult to listen, analyze, and understand where tracks compete across an entire mix.
Using The Masking Meter
Dedicated iZotopians took the time to establish a proprietary psychoacoustic masking hypothesis of what problematic masking might be, and subsequently how to visualize potential problem areas for you to consider when equalizing (Please see (AES 141, Paper 53)1 for more details.).
Neutron includes our Masking Meter technology which shows you in real time:
- Areas of the frequency spectrum where masking is occurring (Masking Meter).
- Frequency regions in which there are multiple instances of masking over time and that are worthy of attention (Masking Histogram).
These tools simply show where masking is occurring. It is up to you to determine when this masking is problematic and requires further action.
Measuring Problematic Masking
In simple terms, Neutron’s Masking Meter takes two audio inputs:
- A source (the active plug-in instance).
- An external input “masker” (the plug-in selected in the Masking Meter drop-down menu).
The Masking Meter uses a model of the outer/middle ear to calculate perceptual loudness of each signal, as well as their loudness relative to one another. The source’s loudness loss due to the masker is then calculated as:
Loudness Loss = Perceived loudness [phons] - Perceived partial loudness [phons]
This calculation is strictly based on the intricacies of human hearing and perception. For more information on this calculation, please see AES 141, Paper 531.
Masking Meter Interface
The Masking Meter includes the following sections:
Meters and Displays
The meters and displays show how the Masking Meter is responding to and processing the input signal:
Spectrum Displays
The spectrum displays of the Masking Meter are the same as those in the Equalizer module. See the Meters and Displays section in the Equalizer chapter for more information.
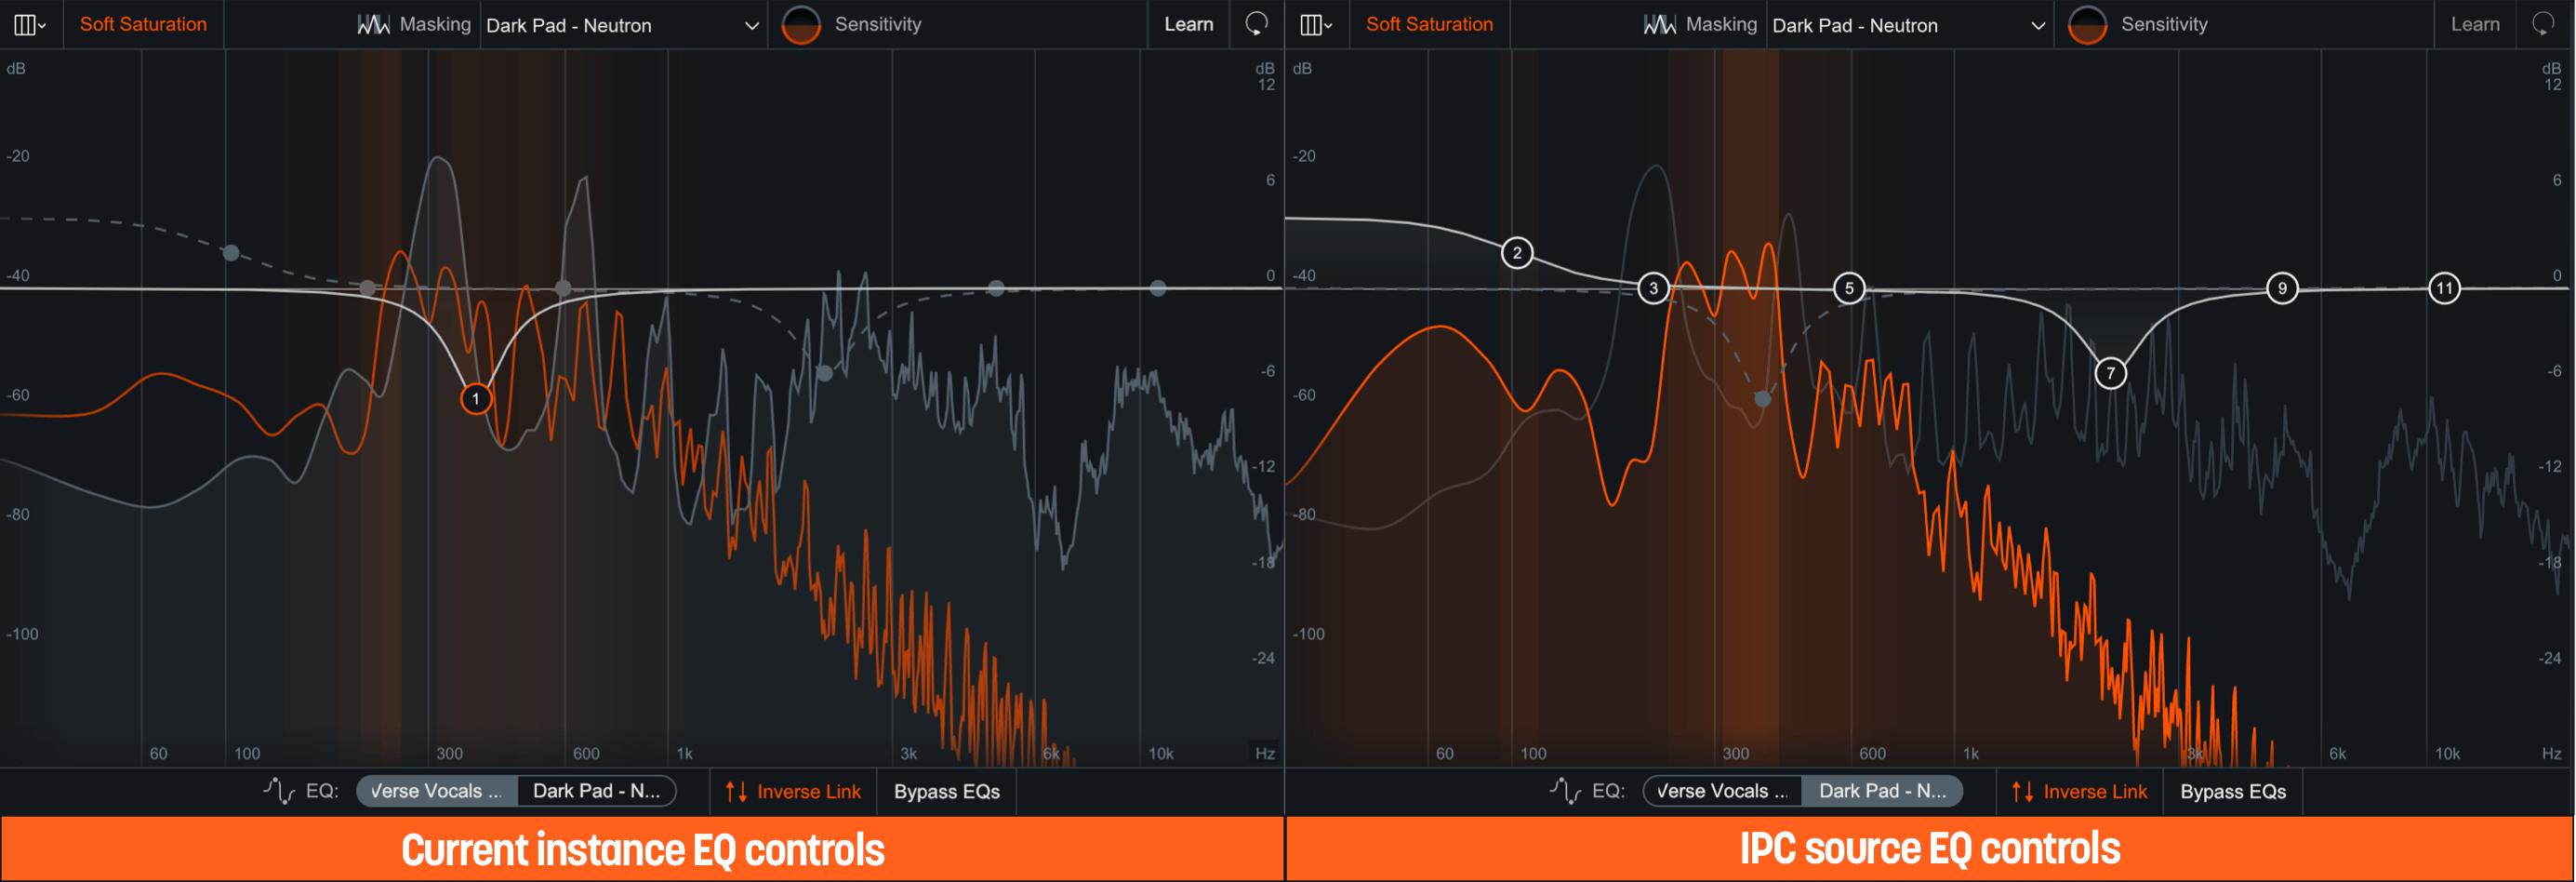
IPC Spectrum Displays
This display only appears when connected to another Neutron instance. Depending on the IPC instance you choose to compare with your current Neutron instance, you will see two different displays:
Neutron EQ IPC Source Selected
Any Neutron instance with an EQ in the signal chain. Displays Masking Meter, Masking Histogram, EQ Masking Controls, and EQ Composite Curve.
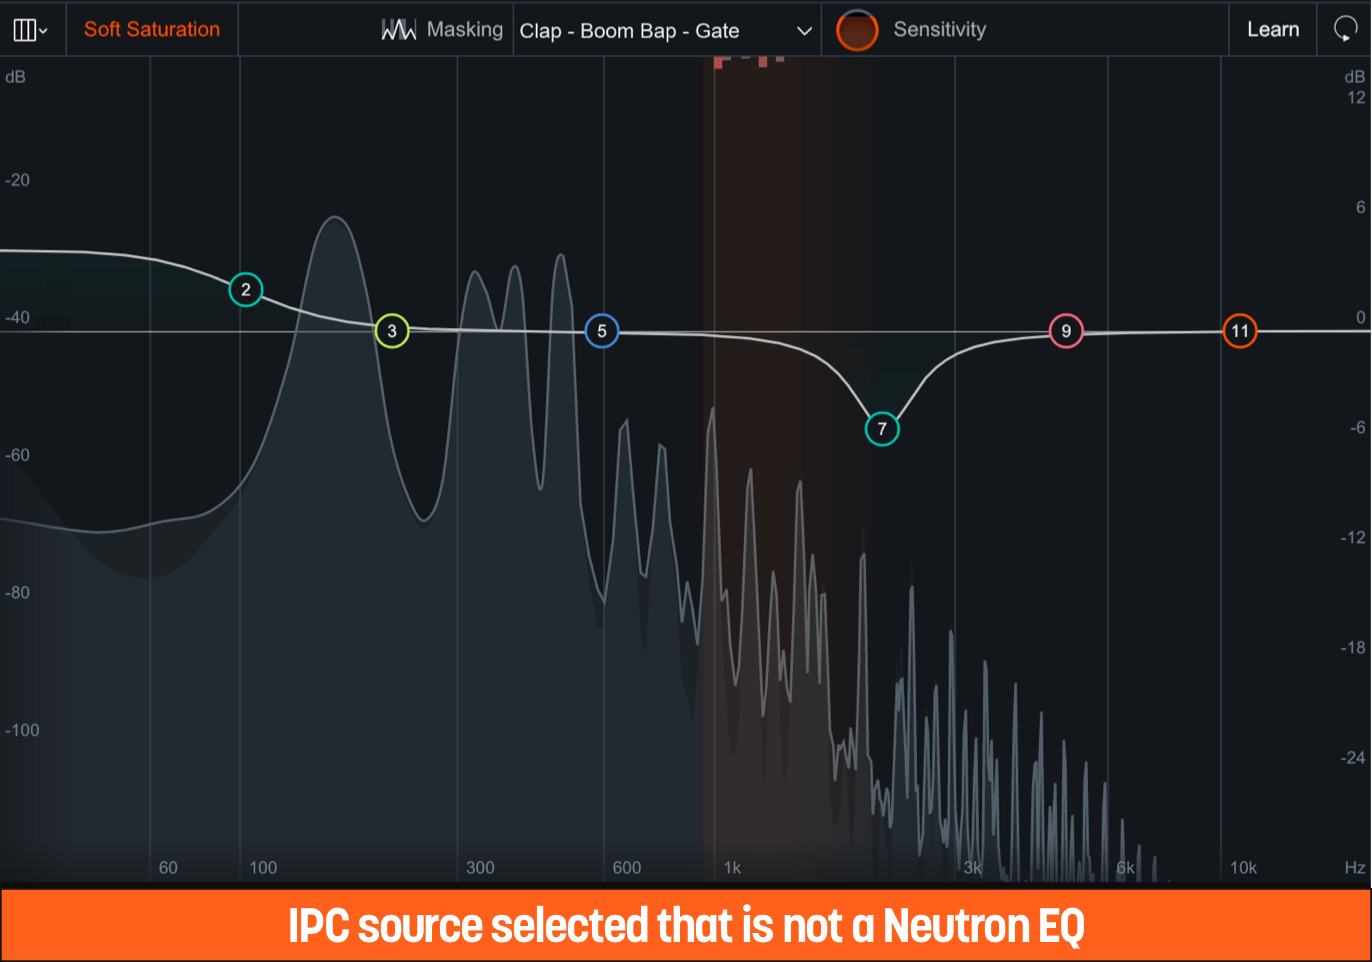
Non-Neutron EQ IPC Source Selected
Any compatible iZotope IPC plug-in. Displays Masking Meter and Masking Histogram with no EQ controls.
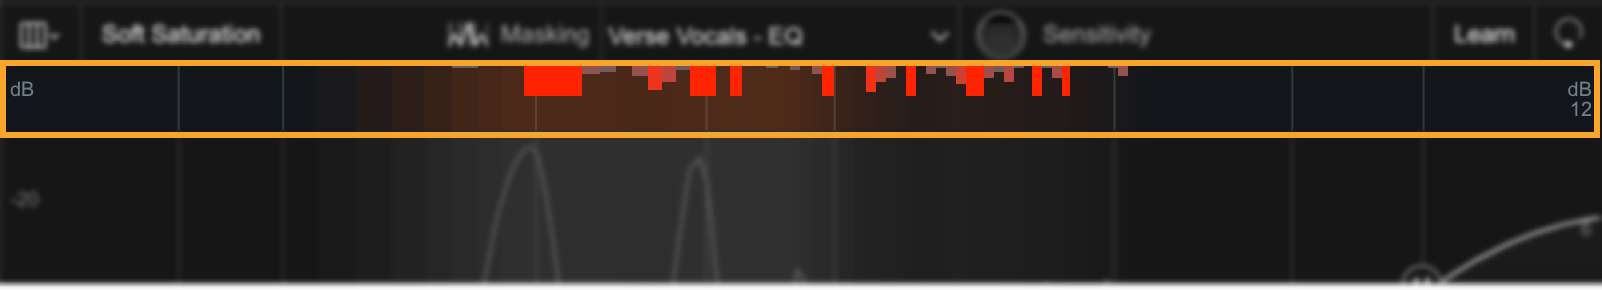
Masking Meter
Displays the highlighted areas of the spectrum to indicate where there is momentary masking (loudness loss) in the frequency domain.
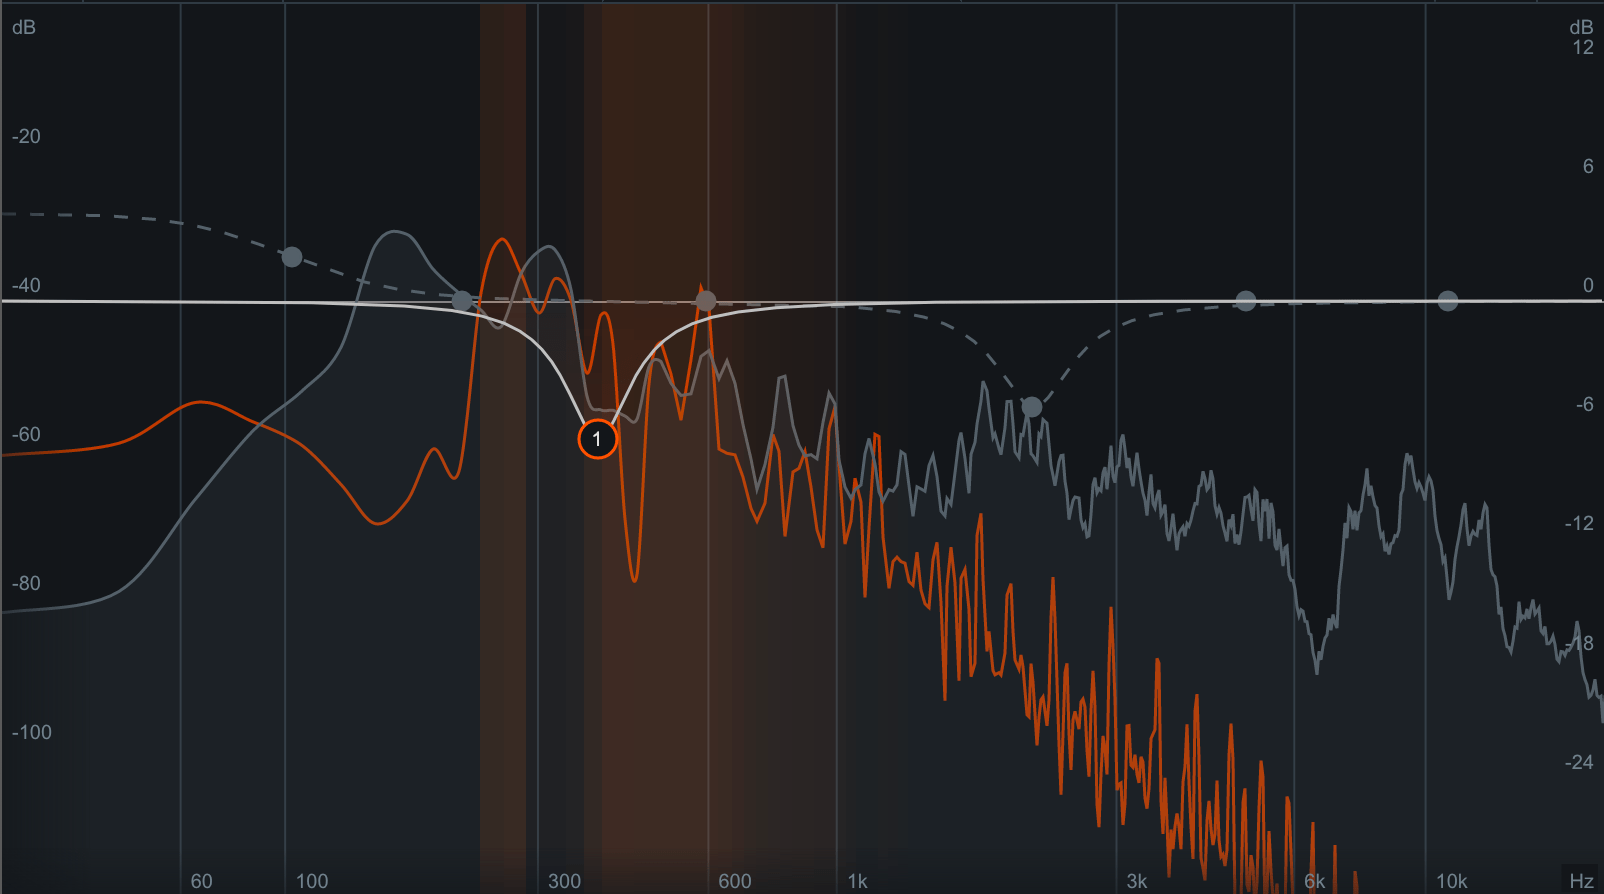
The brighter the highlights, the more masking is occurring in that area.
Masking Histogram
Displays a cumulative representation of frequency collisions—points of extreme masking—occurring in each critical band over time by filling in the histogram meter with a red color.

The more collisions, the more the histogram meter is filled. This provides a zoomed out view of where masking occurs most over a longer period of time.
How the Masking Histogram Works
Masking Histogram counts the number of frequency collisions in each critical band. When the loudness loss in a particular frequency band is over a pre-determined threshold, we consider it extreme masking and tag it as a “collision.” These collisions are represented as a bar extending from the top of the module view. The further they extend down, the more collisions are occurring in those bands.
NOTE: MASKING HISTOGRAM IS A SUGGESTION
Use the results of the Masking Histogram as a suggestion of where there is masking occurring rather than a prescriptive message that you need to fix that area. Masking does not always need to be eliminated, but it is helpful to know where it is when making EQ decisions.
NOTE: Collision Histogram Peak Hold Time
The Masking Histogram is a real-time meter. The peak hold times (found in the Options window) adjust the calculation window between three values of 400 ms, 3,000 ms (default), and Infinite.
Clearing collisions and events
Click once anywhere in the Histogram Area to clear all events in the Masking Histogram.
TIP: MASKING HISTOGRAM AS CLIP INDICATOR
The Masking Histogram can act like a clip indicator—for each frequency band, it shows whether or not extreme masking has occurred. However, unlike a clip indicator, the Masking Histogram counts the number of collisions rather than just showing that at least one instance of clipping has occurred. The more collisions that have occurred in a band, the more its bar grows to bring your attention to problem areas.
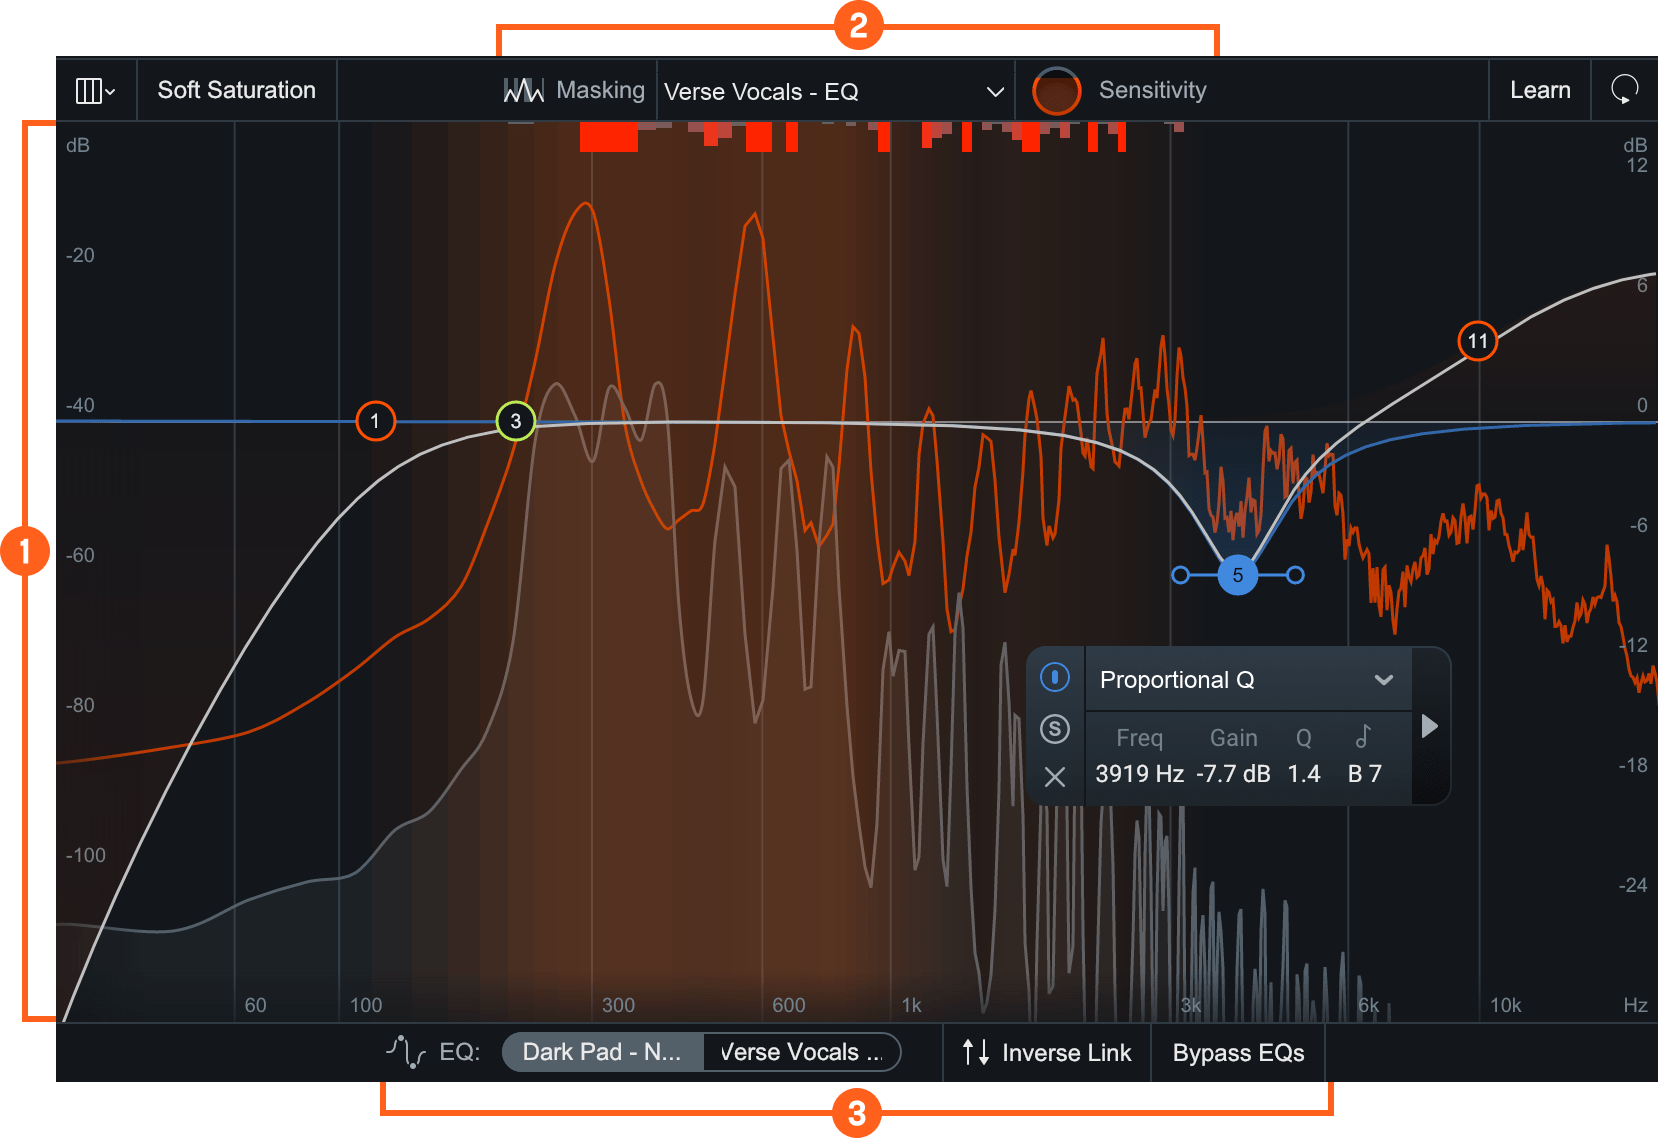
Masking Meter Controls
The main masking meter controls in both non-Neutron EQ as a Masker and Neutron EQ as a Masker are outlined in the image below.

Masking Meter Dropdown Menu
Displays all compatible iZotope plug-ins in your session. When you select one of these instances, the Masking Meter and Masking Histogram will compare the amount of masking (loudness loss) between the selected instance and your current track.
NOTE: Disable automation in remote instances
When making changes to the target EQ, it’s actually sending those changes to the other plug-in. For this reason, adjustments to this second EQ may behave unpredictably with automation. That’s why we recommend not applying automation on a remote EQ instance.
Masking Sensitivity
Scales the threshold used to determine whether loudness loss is extreme enough to count as a collision (and therefore show up in the Masking Histogram).
- At high sensitivity, smaller amounts of loudness loss count as collisions and it will appear that more masking is occurring since the Masking Histogram will fill up more quickly. If you’re seeing no masking but hearing muddiness, it could help to turn the sensitivity up until you see some activity in these meters.
- At low sensitivity, fewer collisions will appear on the Masking Histogram since the loudness loss thresholds will be much higher. Turning down the sensitivity will help show you the most extreme amounts of masking between your tracks.
The range of loudness loss displayed in the Masking Meter is similarly affected by the Masking Sensitivity control.
- At higher sensitivity, a lower amount of loudness loss appears on the meter.
- At lower sensitivity, a larger loudness loss is required to show high amounts of masking (brighter colored lines).
Note: Masking Sensitivity Affects Meter Only
Any adjustments to Masking Sensitivity will not affect processing. Even though it may seem that masking has decreased when the masking sensitivity is turned down, it is merely that the sensitivity of the meter has been adjusted.
Tip: Use Gain Offset For Accurate Masking Calculations
Masking calculations are sensitive to the levels of each track. If you apply a DAW’s track pre-fader, a Neutron instance will not know about this gain change. This directly affects Neutron’s masking calculations. To get the most accurate masking calculations, we recommend setting each Neutron instance’s Gain Offset amount to the same value as the DAW’s track pre-fader. It will not in any way affect the audible gain of Neutron, simply the levels at which masking is calculated.
EQ Masking Controls
The EQ masking mode controls are outlined in the image below.

- EQ Toggle: Switch between your active Neutron instance and the other IPC EQ instance to view and alter the EQ settings in the selected view.
- Inverse Link: Links a node’s Gain and Frequency to another node that is relatively close in frequency from the comparing EQ instance. If Inverse Link chooses a node with a different filter shape, Inverse Link will set the shape of that node to match.
- Bypass EQs: Enable to bypass both the source and the target EQ modules. This is particularly useful to check as you make changes across more than one track, to ensure the EQ adjustments are helping, not hurting, your mix.
Tip: Make subtle adjustments with Inverse Link
Rather than making big, sweeping changes to one track, the goal is to achieve optimal separation with subtle changes to each individual track, such as boosting and cutting each by 1.5 dB rather than boosting or cutting just one track by 3 dB.
NOTE: Inverse Link Controls Gain and Frequency Only
Inverse Link does not control any other aspect of that particular node (e.g. Q, Filter type, Dynamic/Static). Although you may wish to share cuts, boosts and frequency positions, it’s rare that you’d also want to use identical Q in both tracks. It’s best practice to cut with narrower Qs and boost with broader, more gentle shapes, to avoid resonance.