How to use the Quick Profile Generator
As mentioned earlier, an important component for using the simulator is the PID Results Spreadsheet which ties players to player results and results probabilities. These, of course, can be done by hand using whatever numbers you want into a xls Excel spreadsheet. However, this is a pretty time consuming and error prone process so part of the Baseball Situation Simulator provides a way to partially automate that process.
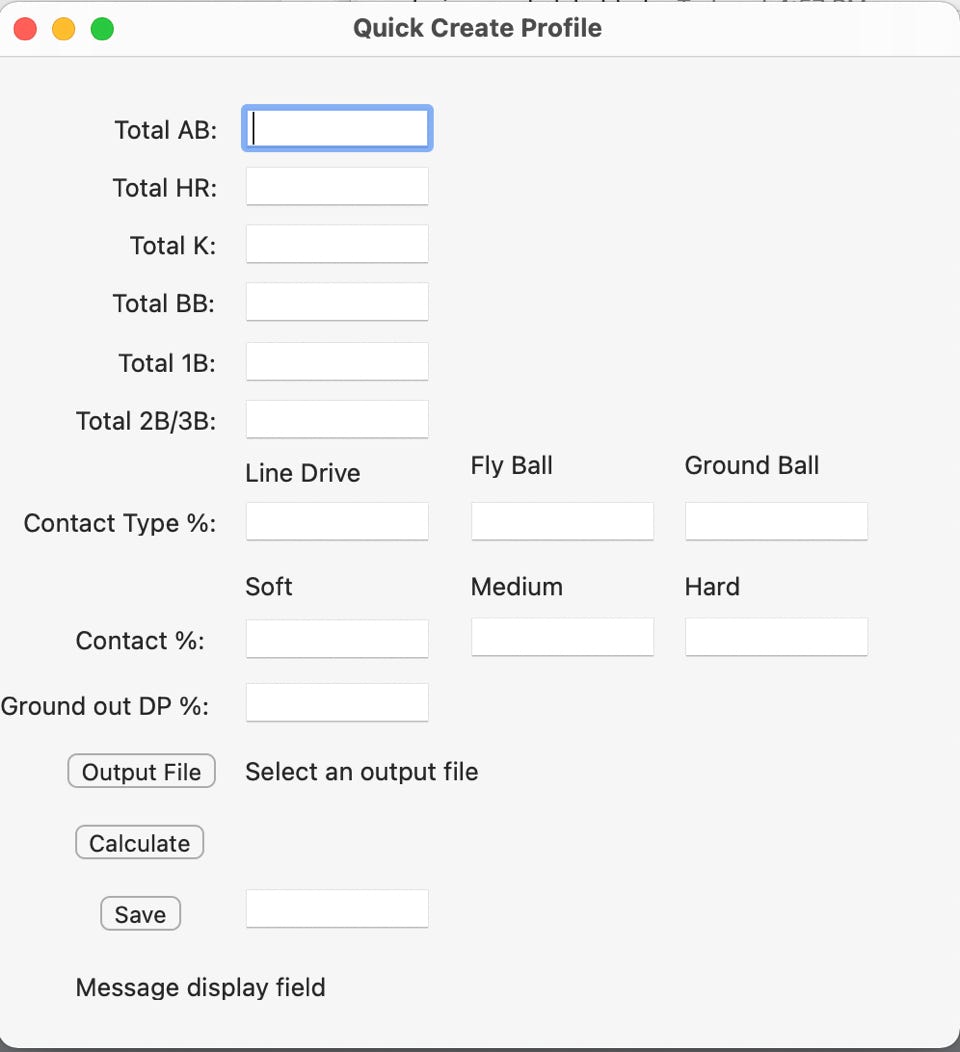
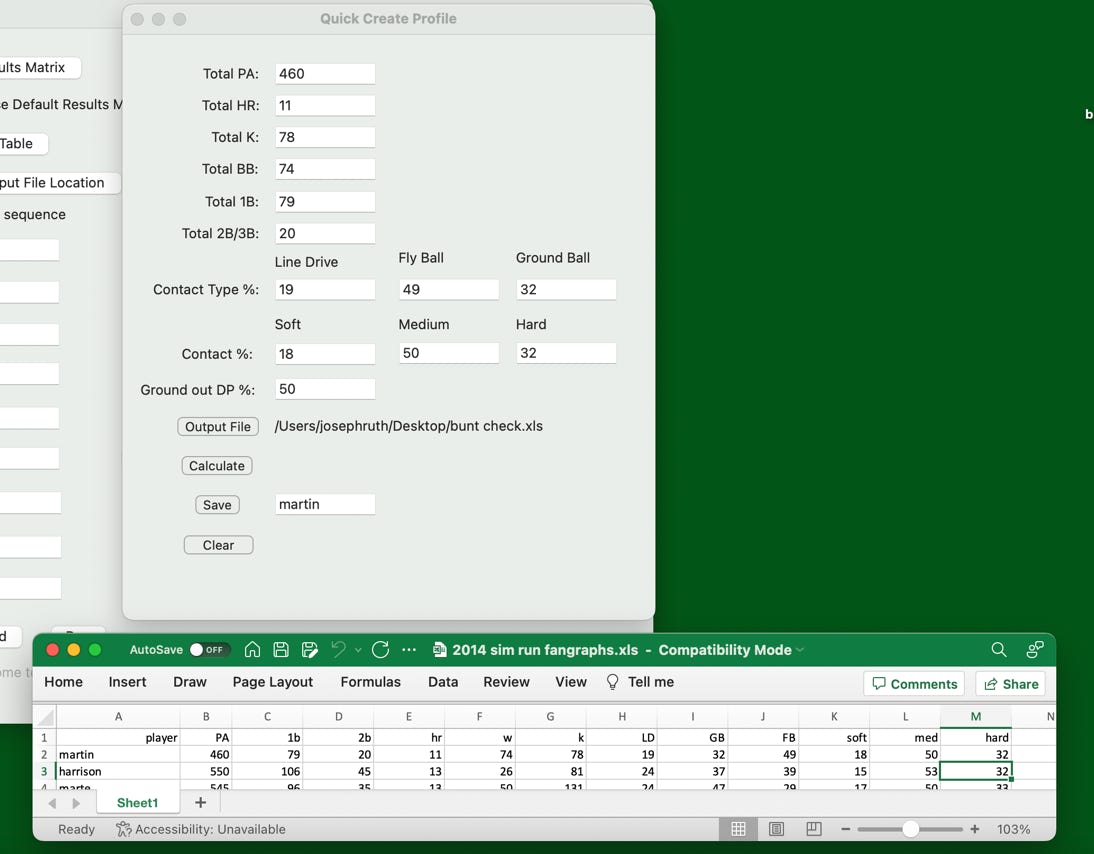
The original version of this product basically only had the long form ‘Profile Generator’ option which required a lot of very specific data to be downloaded and processed by the program. This new ‘Quick Profile Generator’ looks at some summary information which can be obtained a variety of ways and then input into a profile generator screen that looks like this:
Setting up the various profiles needed for you run is the most critical portion of the process and can be pretty time consuming as well. However, I have found that following a simple procedure can speed it up considerably, to the point that you could probably get through setting up a particular lineup (plus some alternative hitters for spice) in about a half an hour. That’s not zero but it’s not all day either.
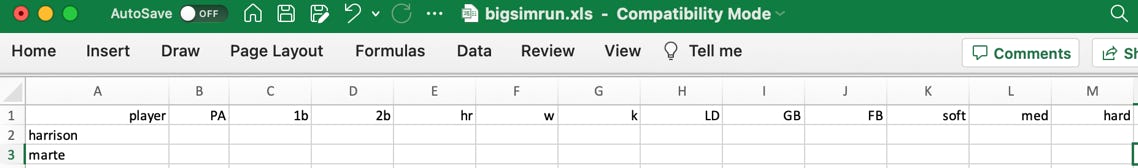
First, make a list of the players you need for your run(s) and set up a spreadsheet that looks like this one here.
There’s a column for each individual stat you will need for a player, as follows:
Player name
Plate Appearance (NOT AT BATs)
Singles
Double and Triples (add the together, triples don’t really matter)
Home Runs
Walks (include HBP)
Strike outs
Line drive percentage
Ground ball percentage
Fly ball percentage
Soft hit ball percentage
Medium hit ball percentage
Hard hit ball percentage
I’d also collect batting average, OBP and slugging percentage. When profiles are generated, those numbers come out as well and getting them from the website and then comparing them with the process results will give you confidence you didn’t make any data entry mistakes anywhere.
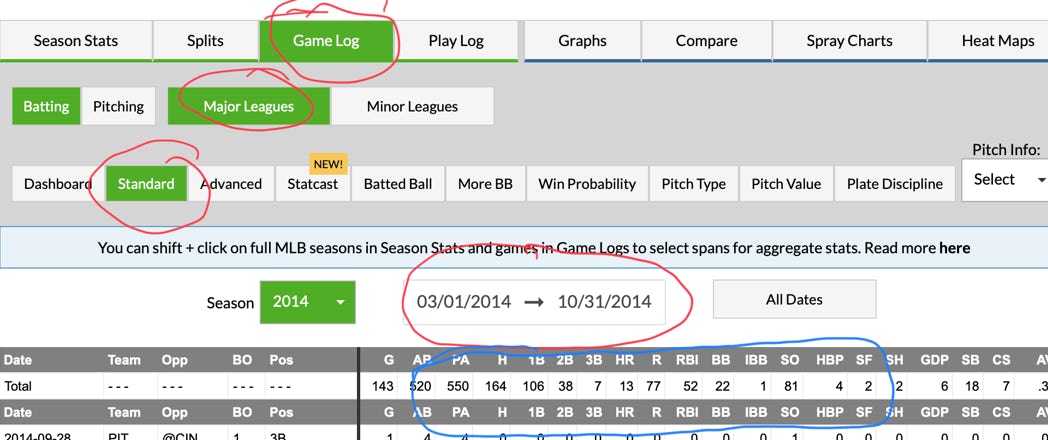
To get those numbers go to Fangraphs and pull up each player one at a time. Click on their game log and adjust the time period for whatever you want to pull.
The click the screen boxes until you see this combination and adjust the desired date range (in red). You can select an entire year by using the Season box. The date range is entirely custom and can span multiple years with start and end dates not aligning with the full season in question. The numbers you want are in the area circled in blue.
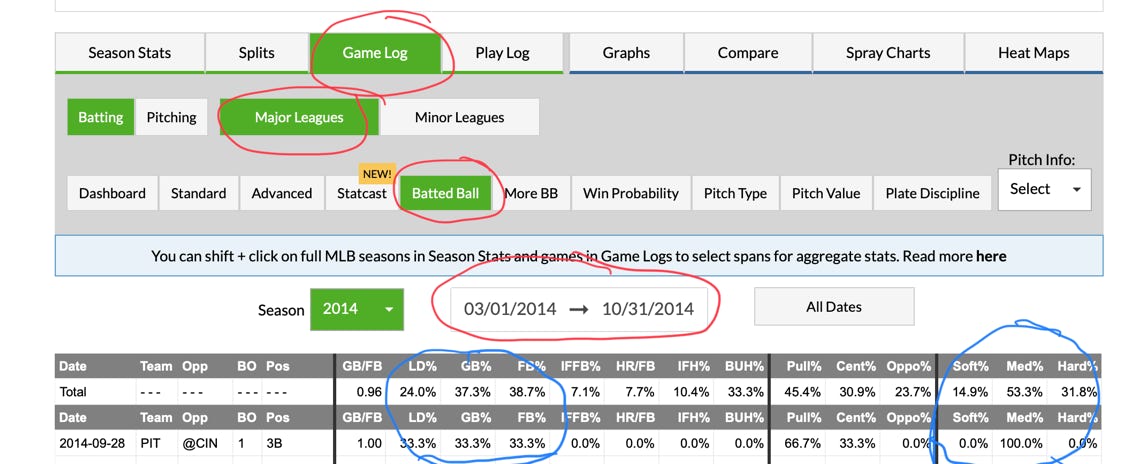
This is how to get the hit type and hit velocity classification. Set up what’s circled in red and then get the figures from the columns circled in blue.
Enter them into the spreadsheet. You can also go to the Dashboard box to get batting average, OBP, and slugging percentage from the site as well.
Once you have filled out your spreadsheet, then you need to first generate a blank PID file if you don’t have one already you want to add to. Follow the instructions from that from the previous page. Click here if you need to see them now.
Now once you have completed the spreadsheet for all of the players on your list and you have a blank profile file, you can start generating profiles. Fill out the screen for each player one by one, calculate the profile, and then save the profile.
Here I have the spreadsheet open at the bottom of the screen and the filled out Quick Create Profile screen above. Need to fill the entire screen out and then press the ‘Calculate’ button.
There is one figure on the box on the page that is going to require some judgement which is the raw average percentages of ground ball outs with a runner on first which result in a double play. The traditional profile generator looked at the numbers and came up with the answer but here you’ll need to supply them. I think for most situations, a number from 50 to 100 percent is probably the right answer depending on the speed of the player involved.
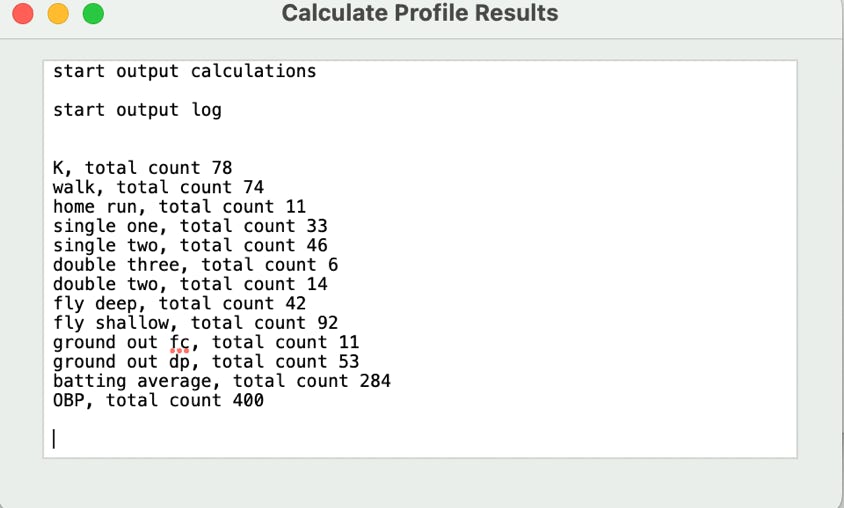
When you press the ‘Calculate’ button a small confirmation window pops up showing raw outcome percentages and some ‘sanity check’ aggregate number.
Batting average, OBP, and slugging percentage are all shown as the last lines on the screen and should be compared to what you collected from Fangraphs. If they’re close, that’s good enough. If they diverge by more than 10 points, probably something is wrong in the data and it should be double checked.
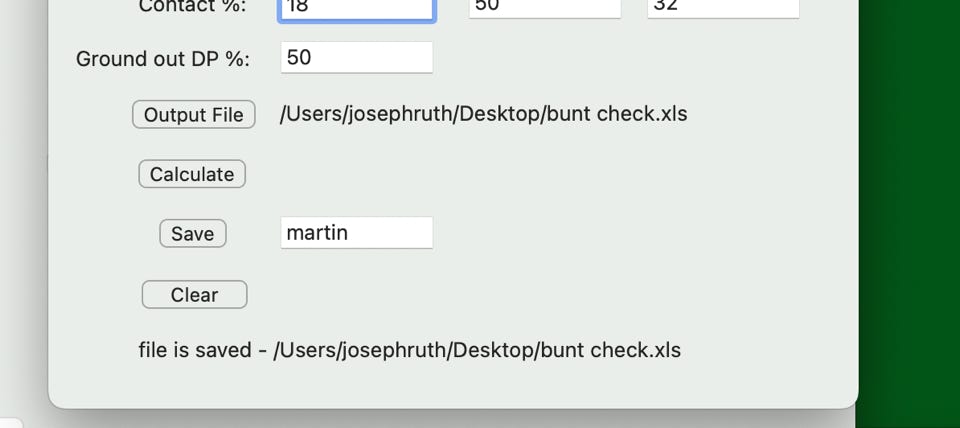
Once that’s done, you can save the calculated data by pressing the ‘Save’ and getting a message that it was all saved successfully.