Baseball Situation Simulator version 12.0 is a program designed to let baseball stat geeks be baseball stat geeks by putting the power of a fully configurable simulator into their hands and under their control. You set up the runs with whatever parameters you want and then you get YOUR results.
# Create custom player result profiles
# Cross checks to make help root out mistakes
# Easy to use simulation processing system
# Complete reporting of each simulator run results
Please be forewarned, this product requires some work to get it to calculate the way you want. Putting the user in control means that the computer program needs to have a lot of detailed information concerning outcomes and percentages by player which is going to take some effort on your part. The payoff is, on the other hand, having the use of a baseball simulator which carries your assumptions and uses your numbers to test an individual single inning offensive situation or stretch of innings 1000s of times, if you like, and generate an aggregate result which you can interpret and use.
You can get the app at the Apple Mac Store as shown below at the following link:
https://apps.apple.com/us/app/baseball-situation-simulator/id1006485835?mt=12
Essentially, you are running an automated version of Strat-o-matic™ baseball which takes a set of statistically defined player at bat results and strings them together into a single inning or a series of innings which define your particular simulator run.
The original 1.0 version of the simulator only allowed single inning scenario runs but version 8.0 finally incorporates multiple inning scenario runs. This allows for more complex analysis tasks such as lineup comparisons and potential trade effects. Also the original, full detailed player profile generation process was enhanced by allowing a second, much easier, quick profile generation process that uses summary stats to avoid having to download and process large amounts of data. Version 12.0 now includes a set of hitting stats cross checks which allows you to validate your run.
The simulator combines inputs from two spreadsheets which the user creates and a screen full of situation details to run a multi-inning offensive situation as many times as your willing to wait and then report on the results. Generally 1000 iterations of a situation can take up to 10 seconds to run. The user can ask for overview results which are presented in a pop up window which can be printed or detail results recorded in an output file which, besides carrying the overview results, also contains a hitter by hitter and iteration by iteration log of the entire simulation run. There is also summary hitter stats that can be cross checked back to what was expected to act as a sanity check.
The first spreadsheet required is a ‘results’ spreadsheet which defines to the simulator all of the ways an hitter plate appearance can turn out. It tells the simulator in a way that it can understand what a particular outcome of a play such as ‘deep fly ball out’ or ‘single’ or whatever you can dream up as a set of instructions which tell the simulator what to do with the the hitter and runners on base for that plate appearance result. You can use the example one provided on this web site, use it as a base and change it, or complete generate a new one more to your liking. The latest version 12.0 has an option to use a default results spreadsheet as opposed to having to create or download one. It is the same one that can be downloaded from the website on the download page.
The second spreadsheet required is the ‘PID result’ spreadsheet which outlines the probabilities that each outcome in the results file has for an individual player. So, let’s say that ‘2013 Jose Tabata’ is a player you wish to refer to during the simulator run. You need to have a set of entries in the ‘PID result’ table which says the player has an x percent chance of result A, y percent changes of result B, etc... The player doesn’t have to have a PID entry for every result in ‘results’ spreadsheet but the percentages of what entries are there should add up to 100 percent.
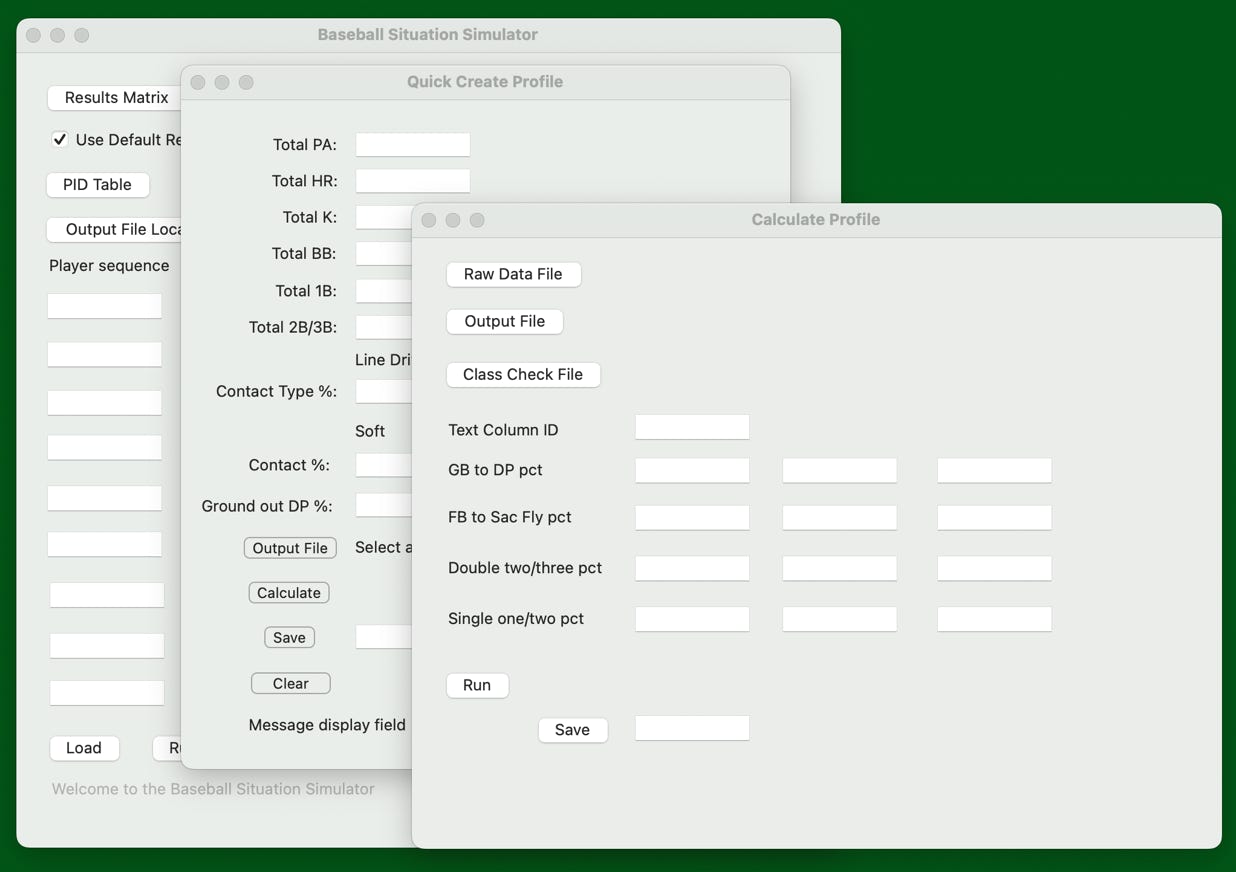
There are two ways that the app can help you come up with a usable and reasonably accurate ‘PID result’ spreadsheet. The first uses detail Fangraphs data that is downloaded and then used in a computer aided analysis. The second uses summary Fangraphs data which is added into a screen and creates the ‘PID result’ spreadsheet entries directly. Of course, you can fill the values into the spreadsheet manually as well if you like.
Here is a rough outline of the first method. The ‘PID result’ spreadsheet can be calculated and/or adjusted by hand or there is a tool called the ‘Profile Generator’ which can turn a spreadsheet of player at bat results into a set of profile entries which can be added into an existing or new ‘PID result’ spreadsheet. For example Fangraphs.com (a well known baseball website), can product an screen full of at bat results for a player over a given time period. That contents of the page can be copied and pasted into a spreadsheet. That spreadsheet can be read by the ‘Profile Generator’ and then classified using a Fangraphs oriented classification file into a set of outcome percentages which can go into the ‘PID result’ spreadsheet. While the ‘Downloadable Example Files’ page has a parsing file oriented to Fangraphs, any set of output results from any website can be used as long as you can get that data into a spreadsheet.
You can learn more about how the long form ‘Profile Generator’ works under the ‘How to use Profile Generator’ section of the site.
A second method uses some relatively easy to find data on the Fangraphs site to allow for the simpler calculation of the players ‘PID result’ spreadsheet entries. The basic process is to look up the player and get their detailed stats for the time period you are interested in, plug them into the ‘Quick Profile Generator’ page, and create the entries. There are some disadvantages to this method as it’s harder to say compare line up results with a player who is ‘hot’ vs the same player who is not ‘hot’. This can be helpful when figuring out the differences in run production when a star is on a tear vs when he is doing ok or just plain old doing poorly. You can still do it but it requires more guess work than the regular ‘Profile Generator’ method.
You can learn more about how the ‘Quick Profile Generator’ works under the ‘How to use Quick Profile Generator’ section of the site.
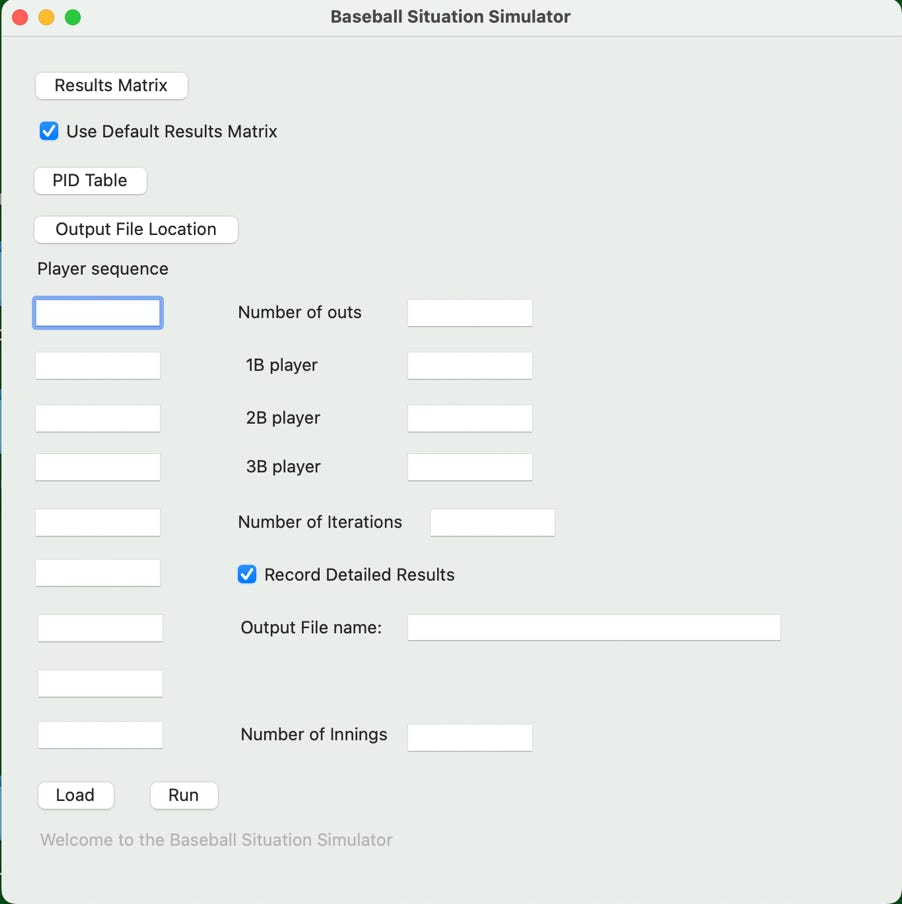
Once you have put these spreadsheets together, the next step is to start the simulator. You’ll see a page that looks like this....
The ‘How to use Situation Simulator’ section goes through this screen in detail and explains how each button and entry field is used. The general idea is that you use the ‘Results Matrix’ button and ‘PID Table’ buttons to bring in the spreadsheets, list the hitting order in the player sequence boxes, indicate what runners are on base, the number of outs, and how many times you’d like to run the simulation in the boxes on the screen.
The ‘Load’ button causes the data to be loaded into the program and check for internal consistency and the ‘Run’ button actually runs the simulation.
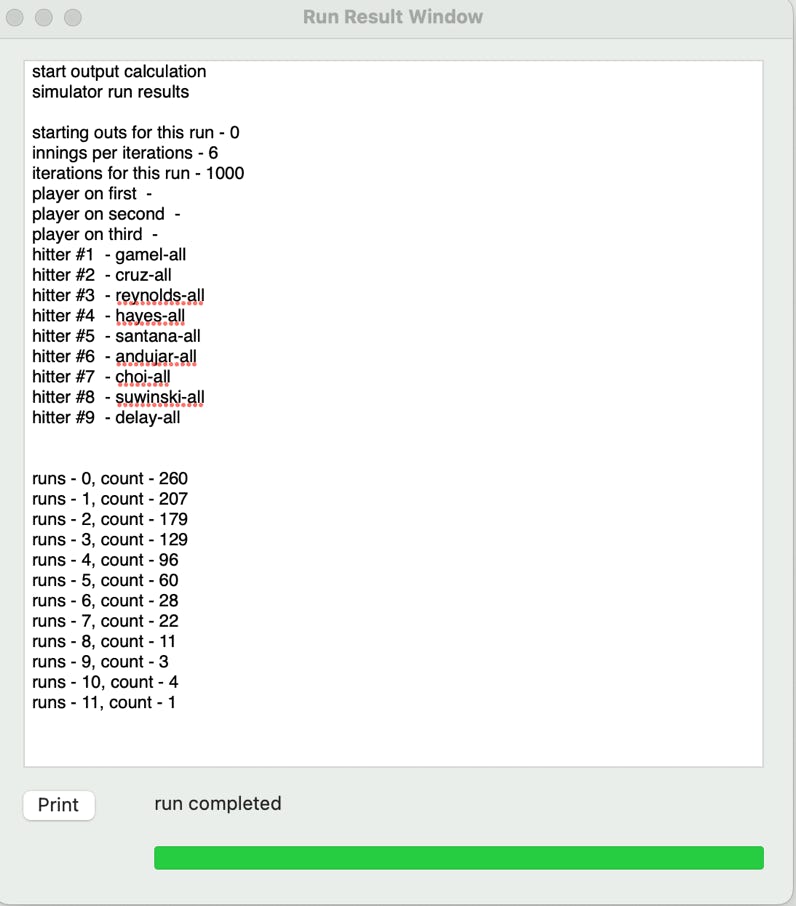
If the ‘Record Detailed Results’ check box is unchecked, after the simulation runs the number of requested times, a new pop up box appears showing the results. It looks like this...
The summary output shows what was entered in the main screen and a summary of the results. The results are split out by number of runs scored and the number of hitters that it took to get that result.
The program also gives you the option of recording all of the gory details hitter by hitter so you can examine and verify them if you like. The data in the file is outlined in the ‘Run Result Log File’ section.
Please read the other sections to get a better, more detailed description of how the simulator works.