PID Results Spreadsheet details
There are two main spreadsheets that drive the core of the Baseball Situation Simulator processor. One of those files is the ‘Results Spreadsheet’. The other is the ‘PID Results Spreadsheet’. This section describes that second core spreadsheet.
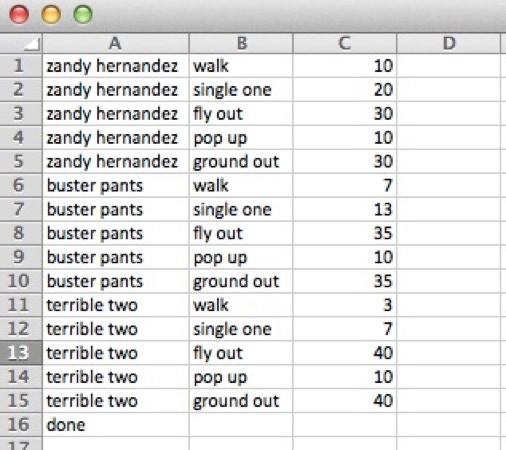
The ‘PID Results Spreadsheet’ ties a player name to a set of results and their expected probabilities. It has a pretty simple structure which you can see below...
The results profile for Zandy Hernandez consists of a series of entries with the player name in column A, the result entry in column B, and the percentage of that result occurring in column C. The result percentage is a floating point number so any number would do. This example shows whole numbers but it doesn’t have to be that way.
Each entry in Column B should have a matching entry in the ‘Results’ spreadsheet. The load process does cross index these tables to look for inconsistencies and will alert you if you refer to a results that’s not in the ‘Results’ spreadsheet.
In short, when the processing cycle is attempting to come up with a result for this player, it generates a random number then applies that random number against the ‘PID Results Spreadsheet’ percentage entries and generates a result. For this to work as expected, the percentages for all results for a given player need to add up to 100. The load process currently does not check for that though that could change pretty easily.
The results profile for given player should be grouped together in the ‘PID Results Spreadsheet’ for you to get the correct results. If you take the result entries for a player and spread them around the list, the actual simulator results will be uncertain. Again, this is something I might fix later.
The spreadsheet needs to be in the Microsoft Excel ‘xls’ 2007 format. If you try to use current Microsoft Excel 2010 format, the program will not work.