
Page 44 - TransportationPlanUsetsGuide
P. 44
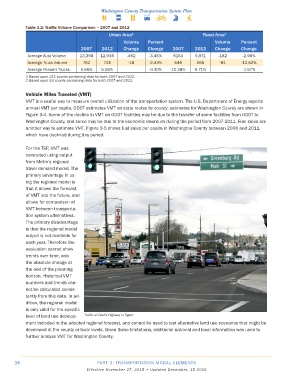
Table 3.2: Traffic Volume Comparison – 2007 and 2012
                                               Urban Area 1                           Rural Area 2
                                                     Volume    Percent                     Volume     Percent
                                   2007    2012      Change    Change    2007     2012     Change     Change
             Average Auto Volume  13,398   12,936     -462     -3.45%    6154      5,971    -182      -2.96%
             Average Truck Volume   762     744        -18     -2.33%     646      565       -81      -12.52%
             Average Percent Trucks  5.66%  5.56%              -0.10%    11.28%   9.71%               -1.57%
            1 Based upon 211 counts containing data for both 2007 and 2012.
            2 Based upon 53 counts containing data for both 2007 and 2012.


            Vehicle Miles Traveled (VMT)
            VMT is a useful way to measure overall utilization of the transportation system. The U.S. Department of Energy reports
            annual VMT per capita. ODOT estimates VMT on state routes by county; estimates for Washington County are shown in
            Figure 3-4. Some of the decline in VMT on ODOT facilities may be due to the transfer of some facilities from ODOT to
            Washington County, and some may be due to the economic downturn during the period from 2007-2011. Fuel sales are
            another way to estimate VMT. Figure 3-5 shows fuel sales per capita in Washington County between 2006 and 2011,
            which have declined during this period.


            For the TSP, VMT was
            computed using output
            from Metro’s regional
            travel demand model. The
            primary advantage in us-
            ing the regional model is
            that it allows the forecast
            of VMT into the future, and
            allows for comparison of
            VMT between transporta-
            tion system alternatives.
            The primary disadvantage
            is that the regional model
            output is not available for
            each year. Therefore the
            evaluation cannot show
            trends over time, only
            the absolute change at
            the end of the planning
            horizon. Historical VMT
            numbers and trends can-
            not be calculated consis-
            tently from this data. In ad-
            dition, the regional model
            is only valid for the specific
            level of land use develop-  Traffic on Pacific Highway in Tigard
            ment included in the adopted regional forecast, and cannot be used to test alternative land use scenarios that might be
            developed at the county or local levels. Given these limitations, additional national and local information was used to
            further analyze VMT for Washington County.


       34                                 PART 3: TRANSPORTATION MODAL ELEMENTS
                                     Effective November 27, 2015 • Updated December, 15 2016