
Page 42 - TransportationPlanUsetsGuide
P. 42
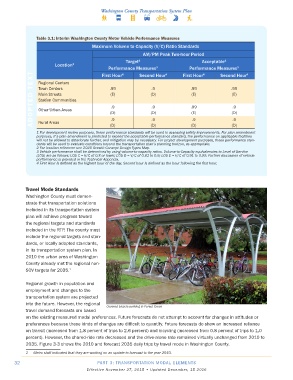
Table 3�1: Interim Washington County Motor Vehicle Performance Measures
                                       Maximum Volume to Capacity (V/C) Ratio Standards
                                                             AM/PM Peak Two-hour Period
                                                      Target 1                       Acceptable 1
                        Location 2
                                              Performance Measures 3  4      First Hour 4    Second Hour 4
                                                                                Performance Measures
                                                                                                    3
               ADOPTED TEXT  Town Centers      .99              (D)              .99              .99
                                            First Hour
                                                           Second Hour
                                                    4
                 Regional Centers
                                                                .9
                                                                                                  (E)
                                                                                 (E)
                                               (E)
                 Main Streets
                 Station Communities
                                                                .9
                                               .9
                                                                                 .99
                                                                                                  .9
                 Other Urban Areas
                                                                                                  (D)
                                               (D)
                                                                (D)
                                                                                 (E)
                                                                                 .9
                                                                .9
                                               .9
                                                                                                  .9
                 Rural Areas
                                               (D)
                                                                                 (D)
                                                                                                  (D)
                                                                (D)
                1 For development review purposes, these performance standards will be used in assessing safety improvements. For plan amendment
                purposes, if a plan amendment is predicted to exceed the acceptable performance standard, the performance on applicable facilities
                will not be allowed to deteriorate further, and mitigation may be necessary. For project development purposes, these performance stan-
                dards will be used to evaluate conditions beyond the transportation plan’s planning horizon, as appropriate.
                2 For location reference see 2040 Growth Concept Design Types Map.
                3 Vehicle performance shall be determined by using volume-to-capacity ratios. Volume-to-Capacity equivalencies to Level of Service
                (LOS) are as follows: LOS C = V/C of 0.8 or lower; LOS D = V/C of 0.81 to 0.9; LOS E = V/C of 0.91 to 0.99. Further discussion of vehicle
                performance is provided in the Technical Appendix.
                4 First Hour is defined as the highest hour of the day. Second hour is defined as the hour following the first hour.
            Travel Mode Standards
            Washington County must demon-
            strate that transportation solutions
            included in its transportation system
            plan will achieve progress toward
            the regional targets and standards
            included in the RTP. The county must
            include the regional targets and stan-
            dards, or locally adopted standards,
            in its transportation system plan. In
            2010 the urban area of Washington
            County already met the regional non-
            SOV targets for 2035. 1

            Regional growth in population and
            employment and changes to the
            transportation system are projected
            into the future. However, the regional
                                              Covered bicycle parking in Forest Grove
            travel demand forecasts are based
            on the existing measured modal preferences. Future forecasts do not attempt to account for changes in attitudes or
            preferences because these kinds of changes are difficult to quantify. Future forecasts do show an increased reliance
            on transit (increased from 1.8 percent of trips to 2.6 percent) and bicycling (increased from 0.8 percent of trips to 1.0
            percent). However, the shared-ride rate decreased and the drive-alone rate remained virtually unchanged from 2010 to
            2035. Figure 3-3 shows the 2010 and forecast 2035 daily trips by travel mode in Washington County.
            1   Metro staff indicated that they are working on an update to forecast to the year 2040.

       32                                 PART 3: TRANSPORTATION MODAL ELEMENTS
                                     Effective November 27, 2015 • Updated December, 15 2016