
Page 46 - TransportationPlanUsetsGuide
P. 46
Roadway Performance
Speed and Reliability
Free flow travel refers to conditions when there are no traffic slow-downs due to the volume of vehicles on the roadway
or other unexpected events. It may include normal stopping at stop signs or traffic lights, and may differ from the posted
travel speeds. Comparing ‘free flow’ vehicle speeds to those measured on an average weekday peak hour (Tuesday
through Thursday, 5:00-6:00 PM), shows the effect of congestion on vehicle speeds. Travel time reliability refers to the
consistency or dependability in travel times. While reliability is related to speed reductions, the two measures are signifi-
cantly different. Reliability focuses on the day-to-day consistency in travel times rather than the level of delay caused by
congestion on a ‘typical’ day. If a corridor is normally slower than free-flow conditions, it may be considered reliable, as
long as the travel time is consistent on a daily basis. However, if travel times dramatically increase compared to ‘normal’
or ‘expected’ conditions the roadway is not considered to be reliable.
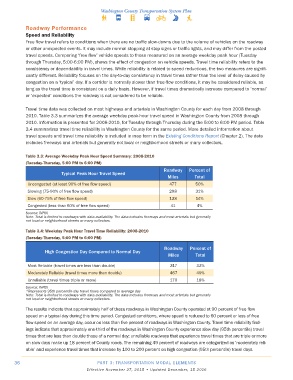
Travel time data was collected on most highways and arterials in Washington County for each day from 2008 through
2010. Table 3.3 summarizes the average weekday peak-hour travel speed in Washington County from 2008 through
2010. Information is presented for 2008-2010, for Tuesday through Thursday during the 5:00 to 6:00 PM period. Table
3.4 summarizes travel time reliability in Washington County for the same period. More detailed information about
travel speeds and travel time reliability is included in map form in the Existing Conditions Report (Chapter 2). The data
includes freeways and arterials but generally not local or neighborhood streets or many collectors.
Table 3�3: Average Weekday Peak Hour Speed Summary: 2008-2010
(Tuesday-Thursday, 5:00 PM to 6:00 PM)
Roadway Percent of
Typical Peak Hour Travel Speed
Miles Total
Uncongested (at least 90% of free flow speed) 477 50%
Slowing (75-90% of free flow speed) 298 31%
Slow (60-75% of free flow speed) 138 14%
Congested (less than 60% of free flow speed) 41 4%
Source: INRIX
Note: Total is limited to roadways with data availability. The data includes freeways and most arterials but generally
not local or neighborhood streets or many collectors.
Table 3�4: Weekday Peak Hour Travel Time Reliability: 2008-2010
(Tuesday-Thursday, 5:00 PM to 6:00 PM)
High Congestion Day Compared to Normal Day Roadway Percent of
Miles Total
Most Reliable (travel times are less than double) 317 33%
Moderately Reliable (travel times more than double) 467 49%
Unreliable (travel times triple or more) 170 18%
Source: INRIX
*Represents 95th percentile day travel times compared to average day
Note: Total is limited to roadways with data availability. The data includes freeways and most arterials but generally
not local or neighborhood streets or many collectors.
The results indicate that approximately half of these roadways in Washington County operated at 90 percent of free flow
speed on a typical day during this time period. Congested conditions, where speed is reduced to 60 percent or less of free
flow speed on an average day, occur on less than five percent of roadways in Washington County. Travel time reliability find-
ings indicate that approximately one-third of the roadways in Washington County experience slow day (95th percentile) travel
times that are less than double those of a normal day; unreliable roadways that experience travel times that are triple or more
on slow days make up 18 percent of County roads. The remaining 49 percent of roadways are categorized as ‘moderately reli-
able’ and experience travel times that increase by 100 to 200 percent on high congestion (95th percentile) travel days.
36 PART 3: TRANSPORTATION MODAL ELEMENTS
Effective November 27, 2015 • Updated December, 15 2016