
Page 43 - TransportationPlanUsetsGuide
P. 43
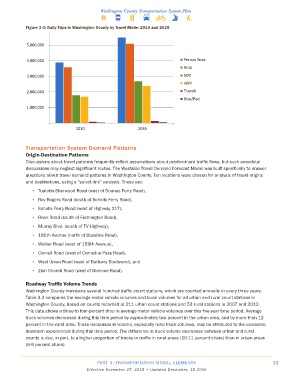
Figure 3-3: Daily Trips in Washington County by Travel Mode: 2010 and 2035


            Transportation System Demand Patterns
            Origin-Destination Patterns
            Discussions about travel patterns frequently reflect assumptions about predominant traffic flows, but such anecdotal
            discussions may neglect significant routes. The Westside Travel Demand Forecast Model was built specifically to answer
            questions about travel demand patterns in Washington County. Ten locations were chosen for analysis of travel origins
            and destinations, using a “select-link” analysis. These are:
              •  Tualatin-Sherwood Road (west of Boones Ferry Road),
              •  Roy Rogers Road (south of Scholls Ferry Road),

              •  Scholls Ferry Road (west of Highway 217),
              •  River Road (south of Farmington Road),
              •  Murray Blvd. (south of TV Highway),
              •  185th Avenue (north of Baseline Road),

              •  Walker Road (west of 158th Avenue),
              •  Cornell Road (west of Cornelius Pass Road),
              •  West Union Road (west of Bethany Boulevard), and

              •  Zion Church Road (west of Glencoe Road).

            Roadway Traffic Volume Trends
            Washington County maintains several hundred traffic count stations, which are counted annually or every three years.
            Table 3.2 compares the average motor vehicle volumes and truck volumes for all urban and rural count stations in
            Washington County, based on counts recorded at 211 urban count stations and 53 rural stations in 2007 and 2012.
            This data shows a three-to four-percent drop in average motor vehicle volumes over this five-year time period. Average
            truck volumes decreased during this time period by approximately two percent in the urban area, and by more than 12
            percent in the rural area. These decreases in volume, especially rural truck volumes, may be attributed to the economic
            downturn experienced during this time period. The difference in truck volume decreases between urban and rural
            counts is due, in part, to a higher proportion of trucks in traffic in rural areas (10-11 percent share) than in urban areas
            (5-6 percent share).


                                          PART 3: TRANSPORTATION MODAL ELEMENTS                                    33
                                     Effective November 27, 2015 • Updated December, 15 2016