
Page 49 - TransportationPlanUsetsGuide
P. 49
Roadway Safety
Transportation safety is a complex subject due to the variety of factors that interact with each other during the course
of a person’s use of the right-of-way. Road conditions, weather, driver attention, and user type (vehicle, pedestrian, etc.)
are just some of the factors that come into play when considering the safety of a particular location. Predictive models
are available, along with an¬ecdotal knowledge and experience with similar conditions. Traffic volumes, crash data, and
on-site observations provide information to analyze locations and travel corridors and determine the types of improve-
ments that would improve safety. Each situation and location is unique and requires engineering analysis and profes-
sional judgment in determin¬ing appropriate safety improvements.
Washington County transportation policies and actions are aimed at improving the overall safety of the County’s transpor-
tation system. Modern techniques, industry standards, and best management practices are used for new construction and
on-going maintenance of the transportation system in Washington County in order to create a safe and reliable network of
roads and bridges. Washington County’s roads, bridges, and traffic safety appurtenances are engineered, constructed, and
maintained to minimize fatalities and personal injuries, and reduce property damage. In addition, active presence by law
enforcement personnel reinforces the rules of the road, contributing to a safer environment for all travelers. Tens of thou-
sands of vehicles traverse Washington County roads on a daily basis and the vast majority of those trips are completed
without incident. However, some locations may have a higher-than-average rate of accidents or crashes.
Motor Vehicle Collision Data
Traffic safety monitoring is based on historical crash data. Primary information comes from local police agency reports
that are submitted to ODOT for processing and evaluation statewide. The ODOT Crash Analysis and Reporting Unit
compiles data for reported motor vehicle traffic crashes occurring on city streets, county roads, and state highways. This
data only reflects reported collisions involving motor vehicles; the number of actual collisions that occur is not known.
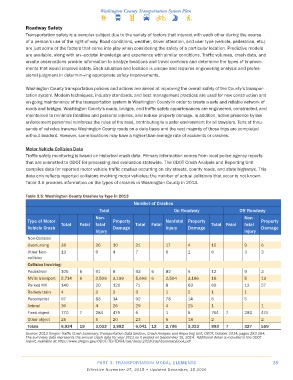
Table 3.5 provides information on the types of crashes in Washington County in 2013.
Table 3�5: Washington County Crashes by Type in 2013
Number of Crashes
Total On Roadway Off Roadway
Non- Non-
Type of Motor Total Fatal fatal Property Total Fatal Nonfatal Property Total Fatal fatal Property
Vehicle Crash Damage Injury Damage Damage
Injury Injury
Non-Collision
Overturning 36 26 10 21 17 4 15 9 6
Other Non- 13 9 4 7 6 1 6 3 3
collision
Collision Involving:
Pedestrian 105 6 91 8 93 6 82 5 12 9 3
MV in transport 5,714 6 2,509 3,199 5,696 6 2,504 3,186 18 5 13
Parked MV 140 20 120 71 8 63 69 12 57
Railway train 4 2 2 3 1 2 1 1
Pedalcyclist 97 83 14 92 78 14 5 5
Animal 30 4 26 29 4 25 1 1
Fixed object 770 7 284 479 6 1 5 764 7 283 474
Other object 25 5 20 23 5 18 2 2
Totals 6,934 19 3,033 3,882 6,041 12 2,706 3,323 893 7 327 559
Source: 2013 Oregon Traffic Crash Summary, Transportation Data Section, Crash Analysis and Reporting Unit, ODOT, October 2014, pages 283-284.
The summary data represents the annual crash data for year 2013 as it existed on September 15, 2014. Additional detail is included in the ODOT
report, available at: http://www.oregon.gov/ODOT/TD/TDATA/car/docs/2013CrashSummaryBook.pdf
PART 3: TRANSPORTATION MODAL ELEMENTS 39
Effective November 27, 2015 • Updated December, 15 2016