 Share this Page
CS491 - Visualization and Visual Analytics
This section contains the projects I worked on for the Visualization and Visual Analytics class, Fall 2009.
Project 1 - Bridge Over Troubled Water
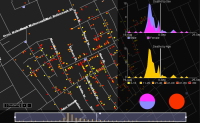 For This project we had to create an interactive version of the John Snow cholera map, using
additional related dynamic data. The tool used for developing the visualization is Processing.
For This project we had to create an interactive version of the John Snow cholera map, using
additional related dynamic data. The tool used for developing the visualization is Processing.
Project 2 - Leaving on a Jet Plane
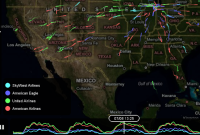 This project focuses on building a mini application for
visualizing data of flights collected from O'Hare Airport Chicago.
The data collected was over a period of one week and had numerous
files which had be converted to some usable format.
This project focuses on building a mini application for
visualizing data of flights collected from O'Hare Airport Chicago.
The data collected was over a period of one week and had numerous
files which had be converted to some usable format.
Project 3 - Saturday Night at the Movies
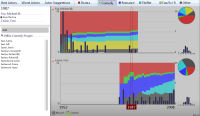 For this project, we had to build an application to visualize data coming from
the Internet Movie Database (IMDB). The application had to offer the user the possibility
of visualizing and comparing the careers of multiple actors and directors, in a way similar to
the NY Times Billboards Rankings. Data preprocessing was of extreme importance for this project, since
the original IMDB text listings data had to be filtered and reorganized in order to bring it down
to an acceptable size and easy-to-load format.
For this project, we had to build an application to visualize data coming from
the Internet Movie Database (IMDB). The application had to offer the user the possibility
of visualizing and comparing the careers of multiple actors and directors, in a way similar to
the NY Times Billboards Rankings. Data preprocessing was of extreme importance for this project, since
the original IMDB text listings data had to be filtered and reorganized in order to bring it down
to an acceptable size and easy-to-load format.
Project 4 - I Heard it Through The Grapevine
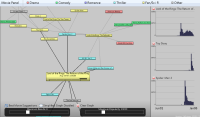 For this project, we had to build an application to visualize movie suggestions
suing data coming from the NetFlix database. Data has to be shown as a force directed graph.
Data also had to be cross linked to the the Internet Movie Database (IMDB) data,
To get additional information about movies.
For this project, we had to build an application to visualize movie suggestions
suing data coming from the NetFlix database. Data has to be shown as a force directed graph.
Data also had to be cross linked to the the Internet Movie Database (IMDB) data,
To get additional information about movies.
Final Project - Flow Visualization on Omega Desk
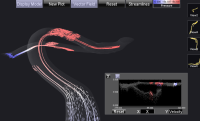 FlowViz is a generic 3D flow visualization for Omega Desk, a multitouch + stereo
3D display system developed at EVL. The application has been built using Processing, and has been designed
to be easily portable to other devices offering a subset of the capabilities of Omega Desk, a stereo, multi touch
display system prototype.
FlowViz is a generic 3D flow visualization for Omega Desk, a multitouch + stereo
3D display system developed at EVL. The application has been built using Processing, and has been designed
to be easily portable to other devices offering a subset of the capabilities of Omega Desk, a stereo, multi touch
display system prototype.