Share this Page
FlowViz
 FlowViz is a generic 3D flow visualization for Omega Desk, a multitouch + stereo
3D display system developed at EVL. The application has been built using Processing, and has been designed
to be easily portable to other devices offering a subset of the capabilities of Omega Desk
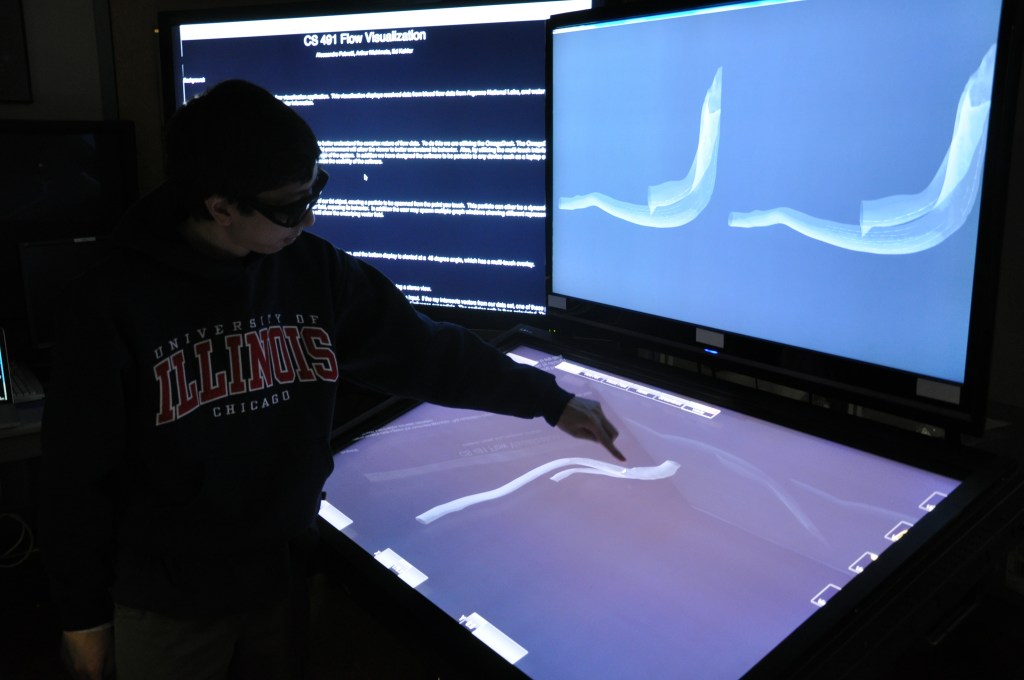
The goal of our project was to create a visualization that enabled the viewer to better understand the complex nature of flow data.
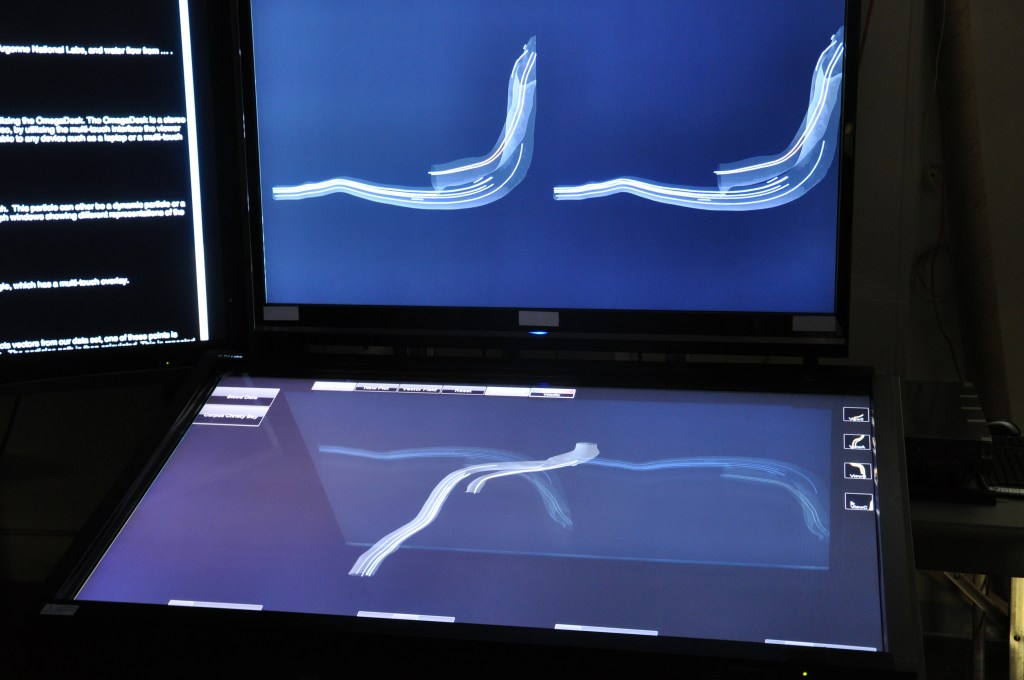
To do this we are utilizing the OmegaDesk. The OmegaDesk is a stereo multi-touch display. It is thought that viewing the complex
3d flow in a native 3d environment will allow the viewer to better understand its behavior. Also, by utilizing the multi-touch
interface the viewer will be allowed to interact with our simulation without having any prior knowledge of the system.
In addition we have designed the software to be portable to any device such as a laptop or a multi-touch table.
We feel that the flexibility to run our application on any device will enhance the usability of the software.
FlowViz is a generic 3D flow visualization for Omega Desk, a multitouch + stereo
3D display system developed at EVL. The application has been built using Processing, and has been designed
to be easily portable to other devices offering a subset of the capabilities of Omega Desk
The goal of our project was to create a visualization that enabled the viewer to better understand the complex nature of flow data.
To do this we are utilizing the OmegaDesk. The OmegaDesk is a stereo multi-touch display. It is thought that viewing the complex
3d flow in a native 3d environment will allow the viewer to better understand its behavior. Also, by utilizing the multi-touch
interface the viewer will be allowed to interact with our simulation without having any prior knowledge of the system.
In addition we have designed the software to be portable to any device such as a laptop or a multi-touch table.
We feel that the flexibility to run our application on any device will enhance the usability of the software.
Application Features
FlowViz has been designed to support the following features:
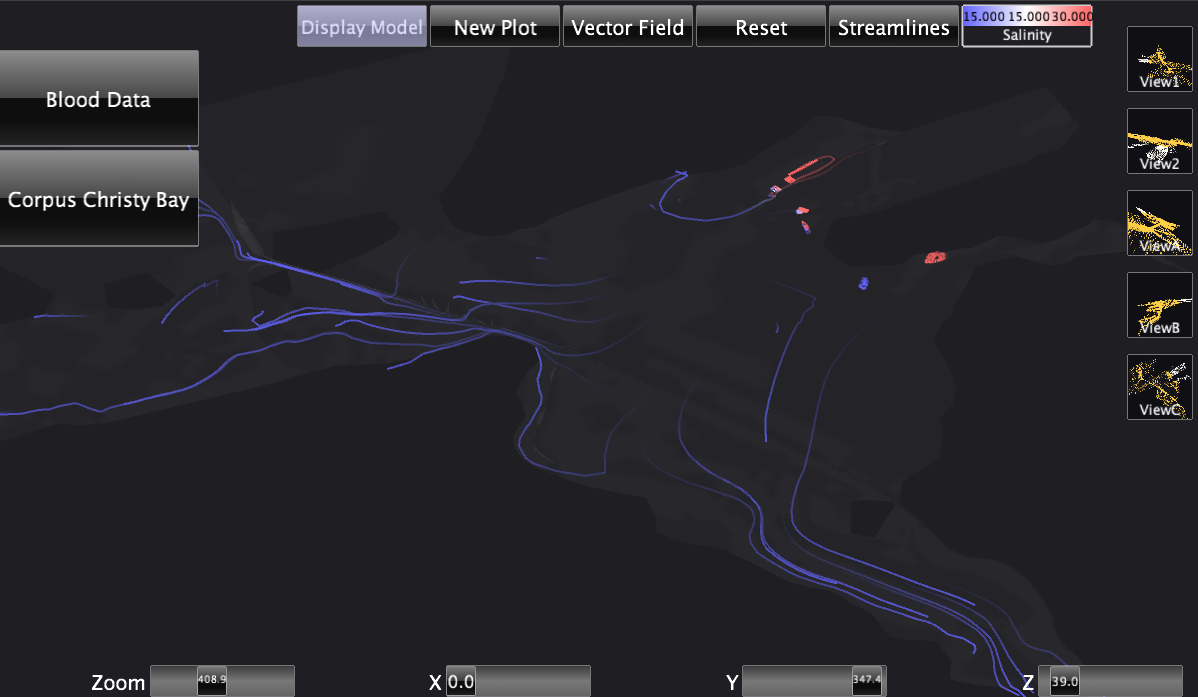
- Multiple dataset support: FlowViz can load and handle eterogeneous datasets. FlowViz uses standard formats (3d Studio files for geometry, CSV for data) to load data, making it easy to convert and visualize existing data inside the application.
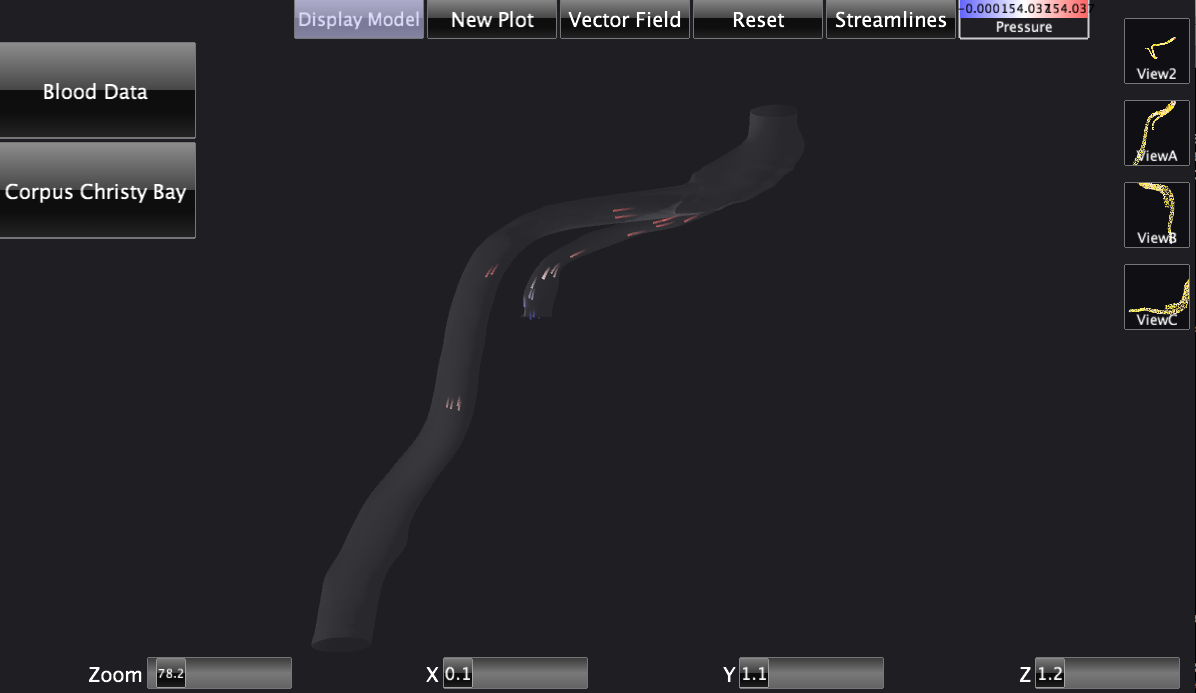
- Custom and predefined data views: The application allows the user to freely manipulate the viewpoint to the data, and also allows the specification of predefined custom viewpoints for each dataset to simplify data navigation.
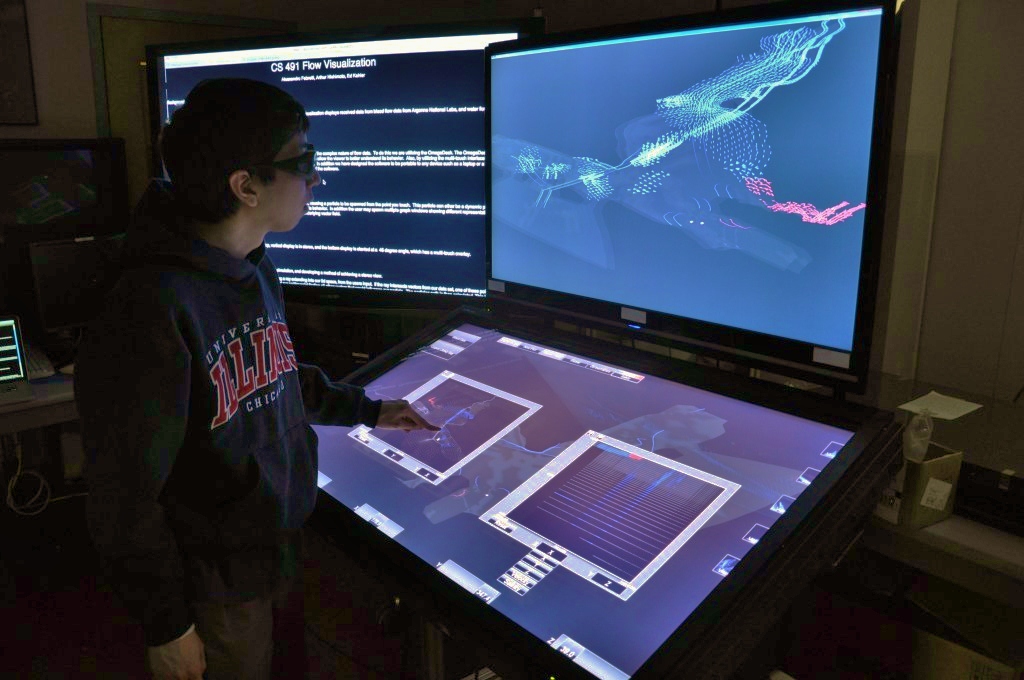
- Scalar data support: Datasets can expose up to 32 separate scalar fields associated with vector data. This fields can be used for color coding or plot generation inside FlowViz
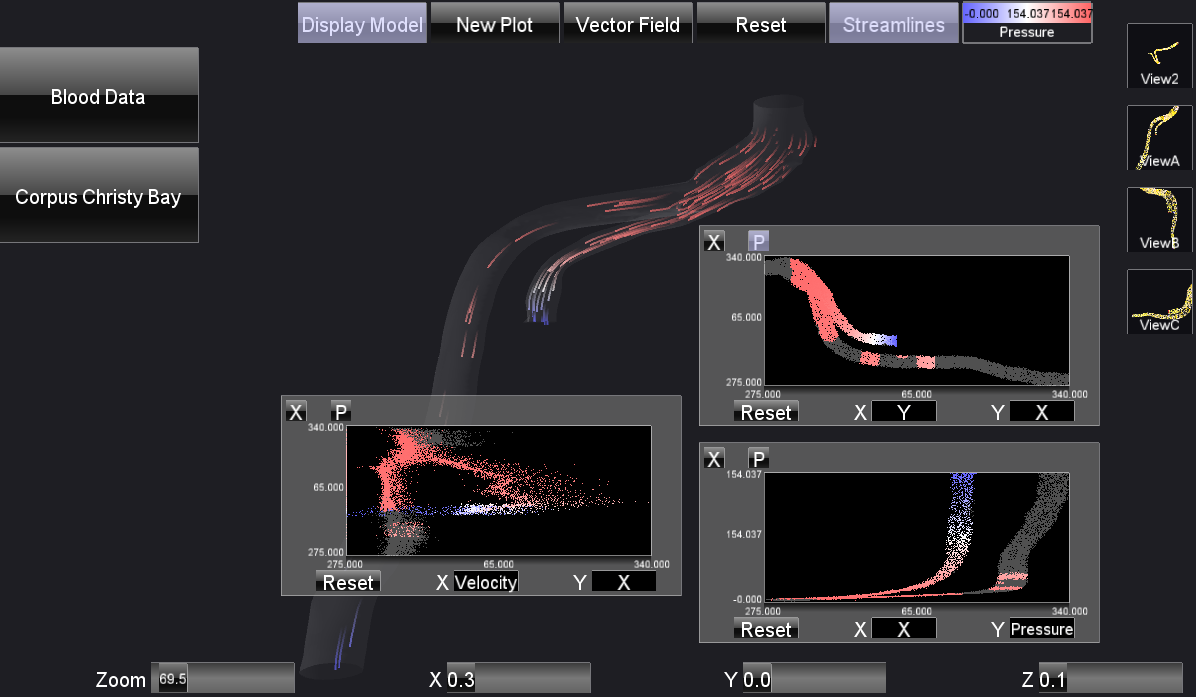
- Data plots: FlowViz supports the creation of multiple custom plots of the dataset vector and scalar information. Non-rectangular brushing is supported in the plot windows, to allow the user to select and analyze custom regions of the dataset.
- Streamline and Particle generation: Users can generate streamlines or animated particle flows and visualize them together with color coded vector fields and plots to better understand the data.
- Scalability: FlowViz has been designed to run on a variety with different platforms exposing different capabilities. Specific application features like 3d stereo, multiple viewports and multitouch can be easily enabled and disabled so the application can gracefully scale back from Omega Desk to a single screen laptop pc.
Datasets
FlowViz Data format
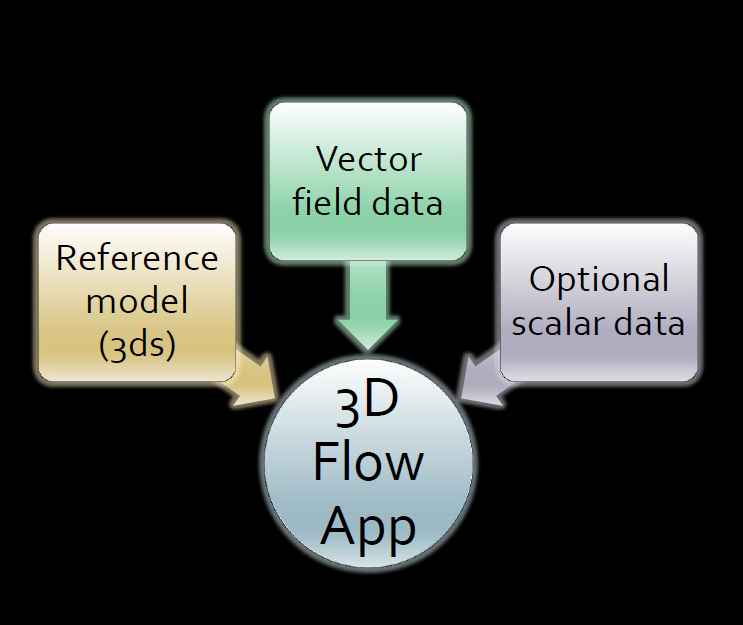
FlowViz loads the dataset using three separate files:
- A configuration file containing references to the other pieces of the dataset, and offering some configuration options.
- A .3ds format file containing the geometry of the 3d model used in the visualization.
- A CSV file containing the actual flow data (both scalars and vector data).
The configuration file
The dataset configuration file contains several options used to configure the dataset loading and visualization: what follows is a brief explanation of the more important ones.
- x, y, z: define the boudaries of the dataset.
- model, data: are references to the 3d model and data files respectively.
- scale_x, scale_y, scale_z: define the scale of the dataset.
- point_cols, vector_cols: define wich columns in the CSV file store the point poistions and vector data.
- scalar [name] [column]: defines a scalar.
- view [name] [x] [y] [z] [zoom]: defines a predefined viewpoint for the dataset.
- flo_dt, flo_len, flo_area, ...: specify parameters used by the streamline and vector generation algorithm.
Flow Simulation
The simulation consists in the ability to touch a 2d representation of our 3d object, causing a particle to be spawned from the point touched. This particle can ether be a dynamic particle or a static streamline. The particle that is generated will flow through the vector field, exposing its behavior. In addition the user may spawn multiple graph windows showing different representations of the model. In this graph the view can brush over and select a portion which will show the underlying vector field.Multitouch support
The touch functionality for the Flow Visualization was done using the OmegaDesk multi-touch surface. The OmegaDeskConnector is a C# application that implements the C# API that comes with the touch surface. The connector is capable of sending touch points and/or touch gestures to any application that connects to it. For this application we're connecting to Processing. The InputManager of the FlowVis Processing application connects to the OmegaDeskConnetor and receives the touch data as a string containing the touch name and six numeric parameters. The InputManager parses the string and generates input events which is then sent to the user interface components.Additional Screenshots and Download