Share this Page
CS491 Project 4 - I Heard it through the Grapevine
For this project, we had to build an application to visualize movie suggestions suing data coming from the NetFlix database. Data has to be shown as a force directed graph. Data also had to be cross linked to the the Internet Movie Database (IMDB) data, To get additional information about movies.
Data Preprocessing
The initial data parsing involved filtering all the movies with less than 2500 rentals and accumulating all the relevant data into a large file. This filtered the number of movies to 4625. The data required to calculate the averages, and other general information was grabbed during this step. The next step involved loading this data into a database for further filtering. Using the database, customers with less than 50 rentals were filtered. We also discarded all records with ratings of 3 and 4 to reduce the dataset to a manageable size. This reduced the initial 100 millions records to about 37 million records. Using the database, a text file was generated, with all the records ordered by customers to help generate the suggestions for each movie.
The suggestions for each movie was generated in a matrix form i.e a 4625 X 4625 matrix with an entry Matrix[i][j] indicating the number of renters who rented both movie "i" and movie "j" and gave both movies a rating of 5. This data was used to calculate the list of suggestions. This data was generated in about 15 min for the reduced dataset. For the bad movie version, Matrix[i][j] indicates the number of renters who rated both movie "i" and movie "j" high i.e gave it a rating of 5 minus the number of people who rated movie "i" high but ended up giving movie "j" a bad rating i.e less than 3. For a movie "i" We actually ended up considering all the customers, which took a processin time of about 40 min.
The genre matching was a little tricky. We loaded data from the imdb dataset into a MySQL table and data from the Netflix dataset into another table and trying a natural join on the movie name and the release date. Matching on the release date was necessary to prevent inconsistent results. This resulted in about 3100 movies. After normalizing the names by wiping out any leading 'The', replacing the '&' character with 'and', wiping out punctuation such as commas, colons, and hyphens, the number of matches increased to about 3300. Most of the remaining mis-matches were due to inconsistencies among the 2 databases on release date. For example, Screamers was released in 1995 according to IMDB but 1996 according to Netflix.
Application Features
Application layout
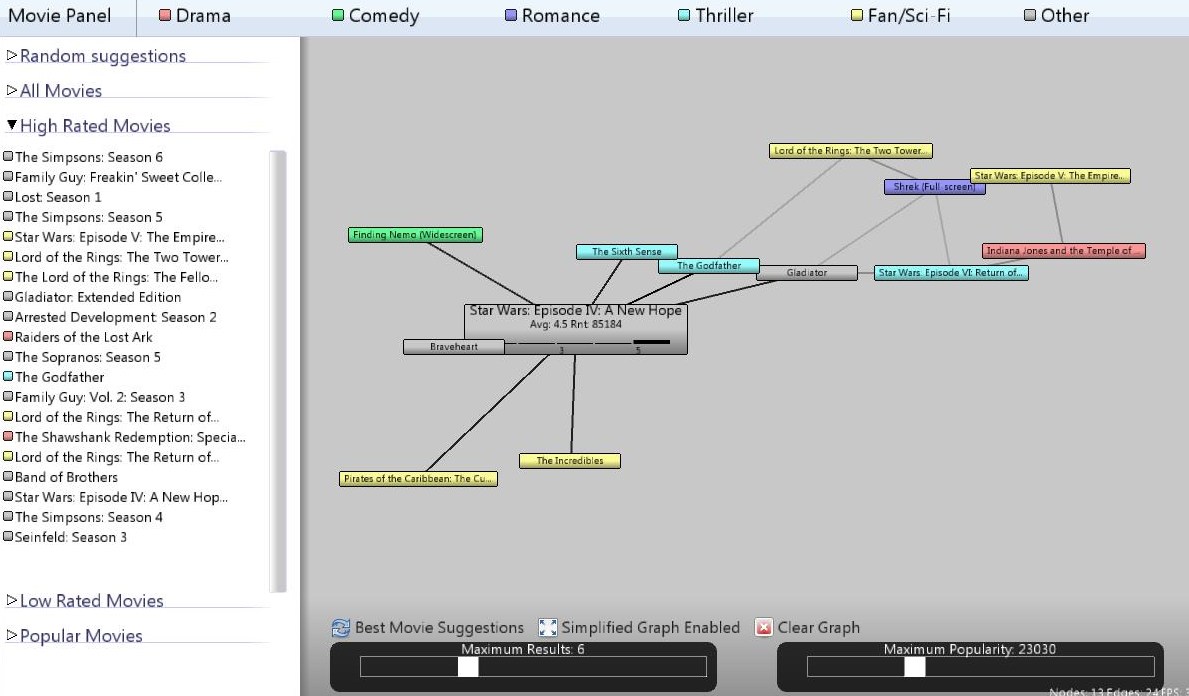
The application is divided into four main sections, the toolbar, the movie panel, the graph and the plot area.
- The Toolbar, on the top of the application window, exposes buttons to show or hide the movie panel, and displays a legend of the movie genre categories used in the visualization. The genre legend items are actually clickable in order to enable genre filtering, as explained in the following sections.
- The Movie Panel, located on the left of the application window, is the central location used for datab navigation, searching and movie selection.
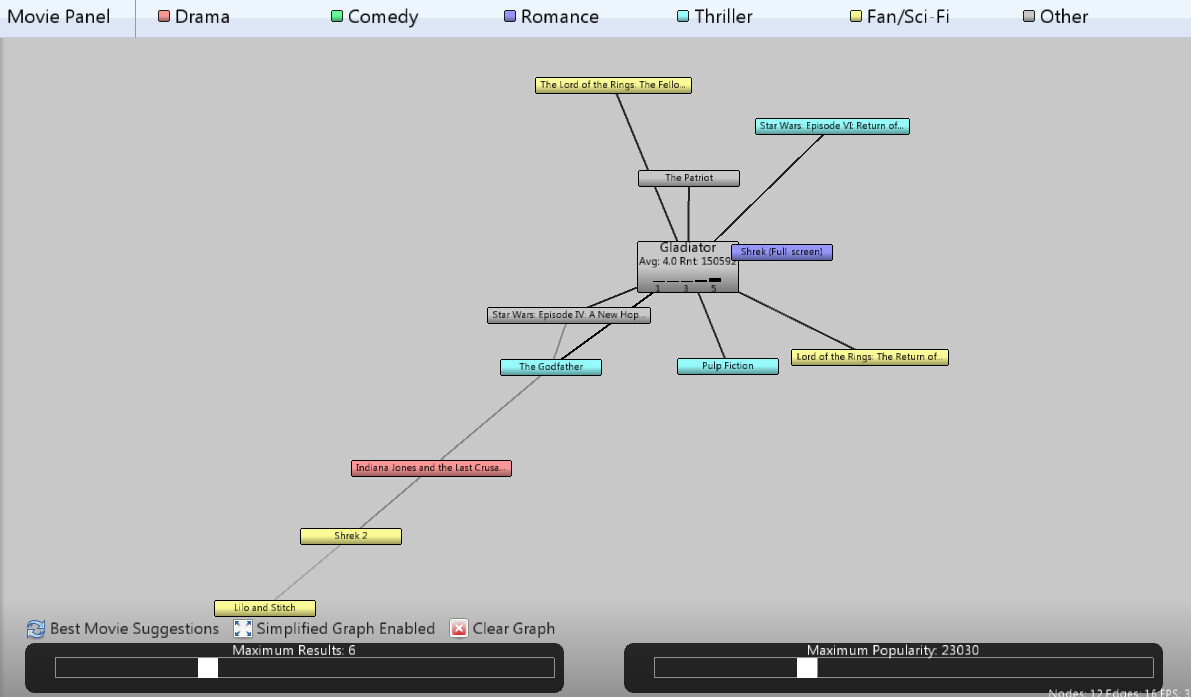
- The Graph Area is the central area of the application: here is where the movie suggestion graph is visualized and manipulated.
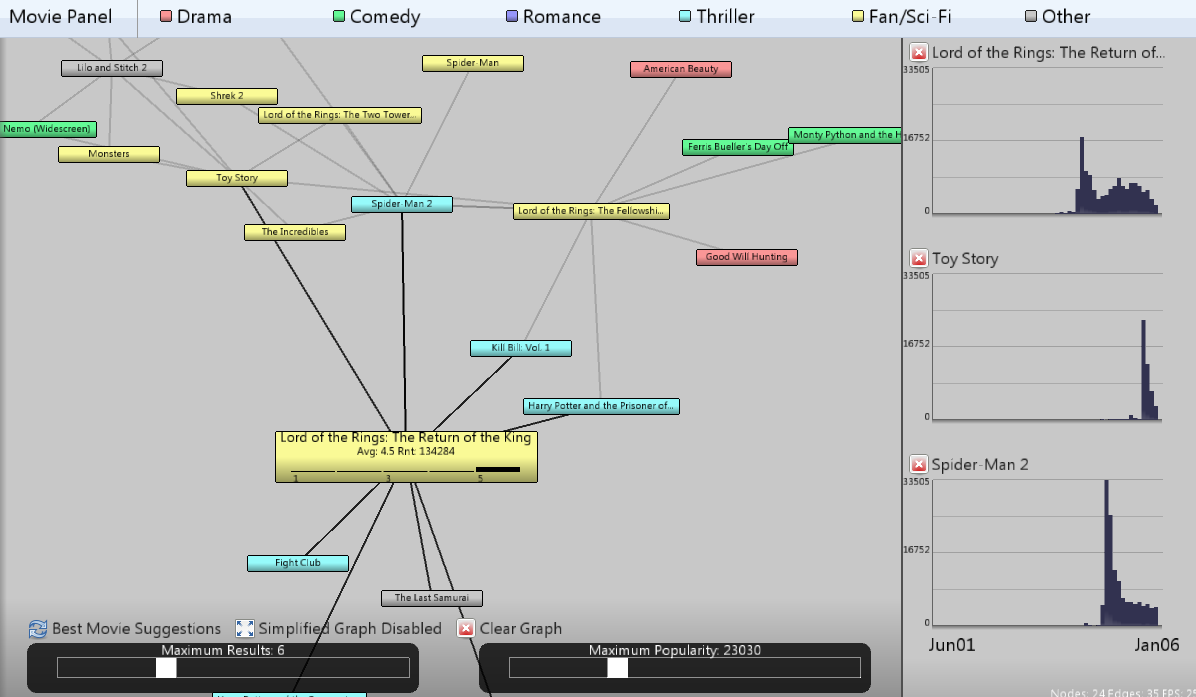
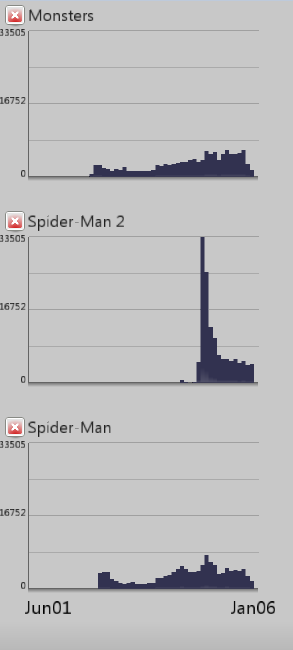
- The Plot Area is an additional side panel to the right of the graph area, dedicated to visualizing the rental charts of selected movies. The usage of this panel will be explained further in another section of this page.
Selecting Movies
To add an movie plot to the graph area, it is enough to select it from the movie panel listings. The movie panel offers a number of different views to the source data, called filters:
- The Random Suggestions give, guess what, a random set of movies from the database.
- The High Rated Suggestions give a list of movies with a high average rating.
- The Low Rated Suggestions give a list of movies with a low average rating.
- The Popular Suggestions give the list of movies with most rentals.
- The Genre Suggestions (displayed only when a genre button is selected) display the list of movies of that specific genre.
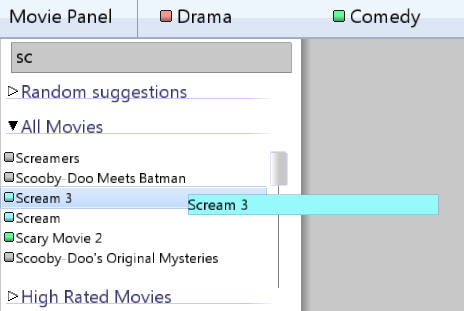
Navigating through the filters is extremely easy. The user can expand / collapse every single filter to display its contents, and then click on the individual entries to add the specified movie to the graph area. All of the filters also support real time searching: the user can start typing text at any time to have the contents of filters automatically searched for the specified string.
Manipulating the Graph
Once one or more movies have been added to the graph area, the user can start interacting with them, and with the overall graph, in the following ways:
- Left-clicking a movie expands the movie.
- Right-clicking a movie deletes the movie from the graph.
- Left-clicking and dragging everywhere, pans the graph.
- Mouse wheel scrolling changes the graph zoom level.
- Middle clicking on a node adds the movie rental chart to the plot panel.
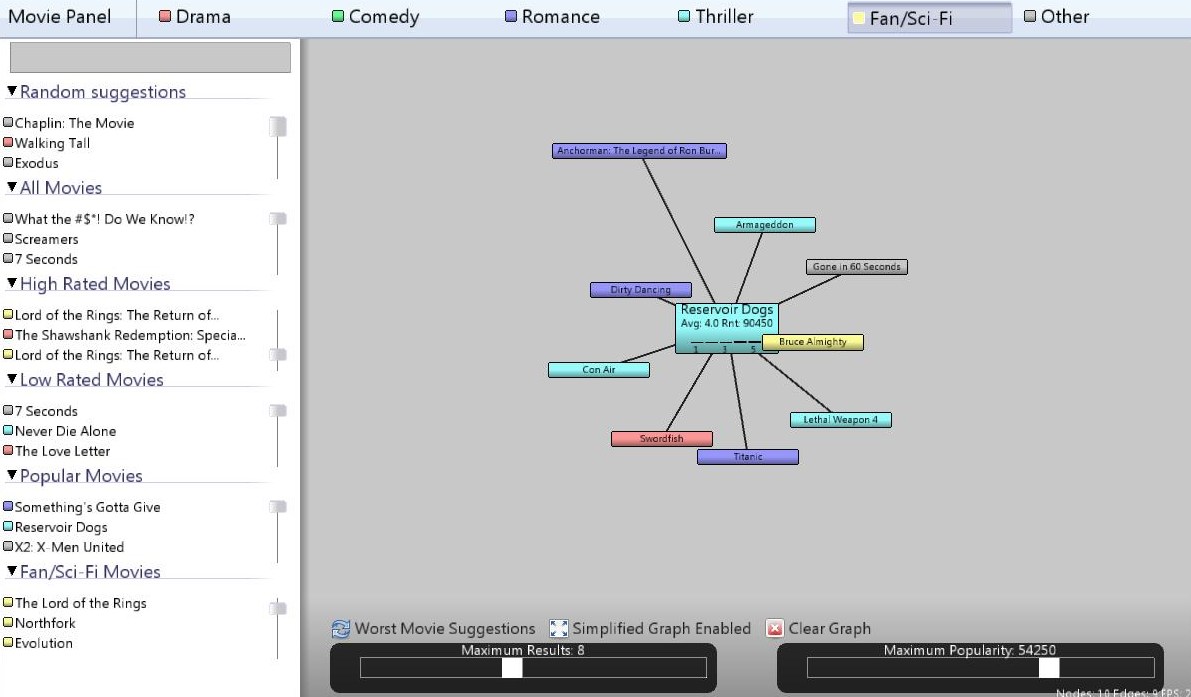
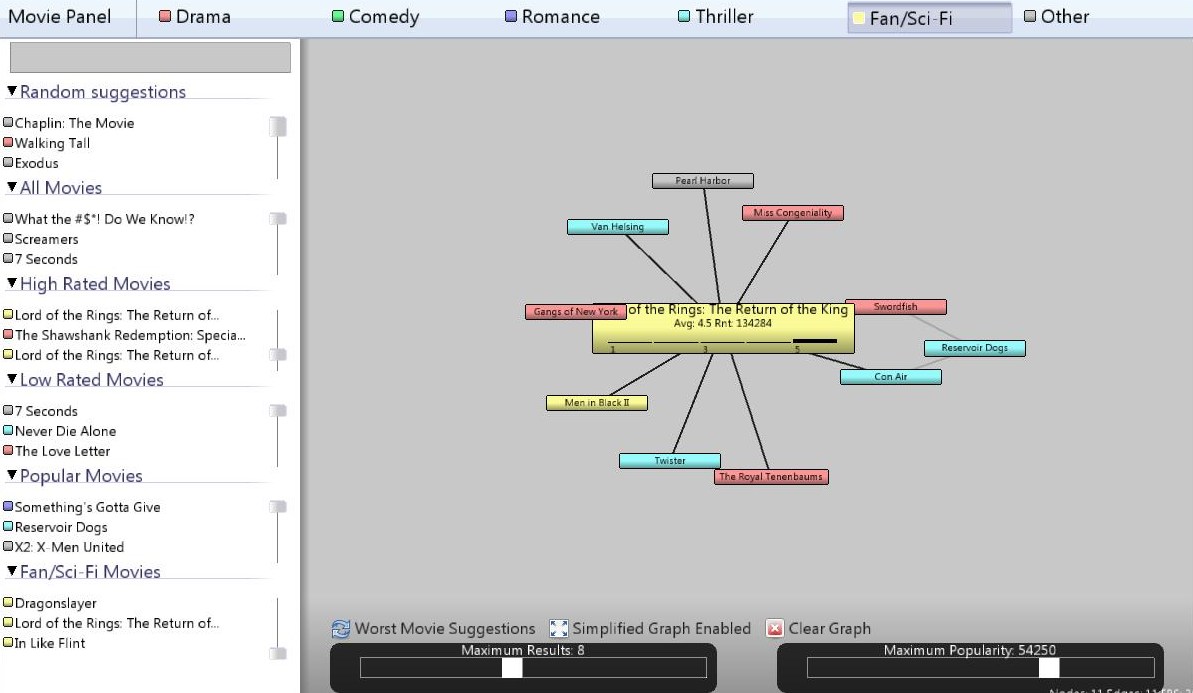
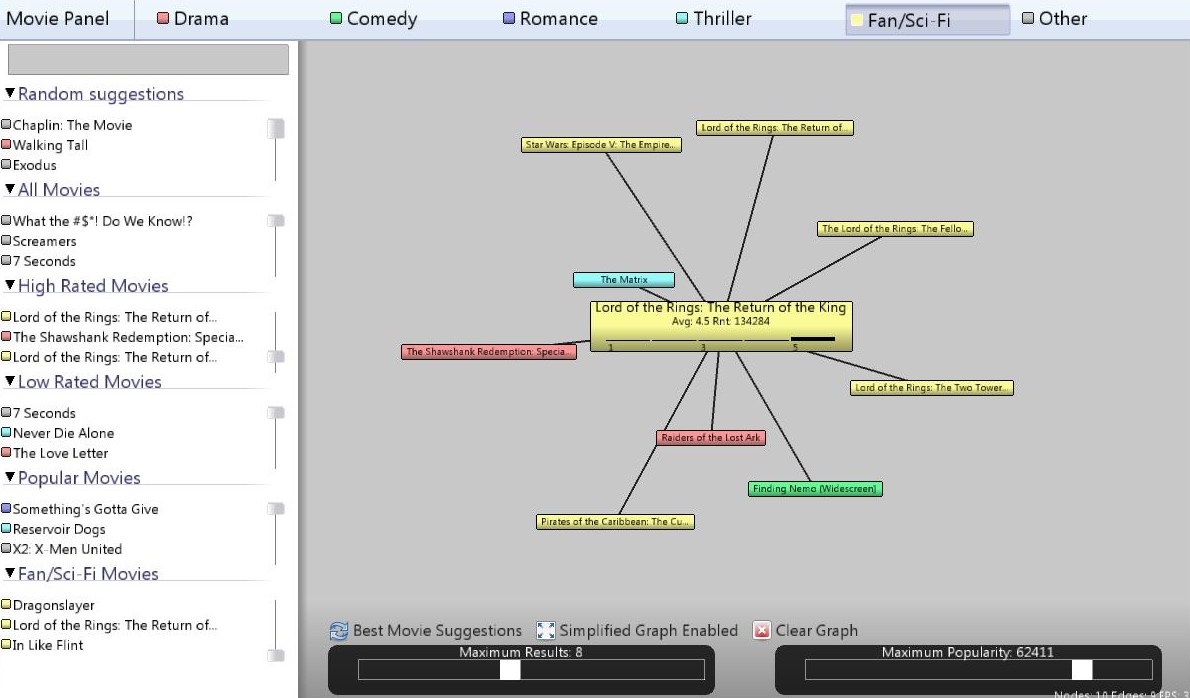
- Hovering on a movie enables neighbor outlining: All of the movies not linked to the current one will fade away. A hovered movie box also displays additional information about that movie, similarly to what happens for an expanded movie. This additional info consists of the movie average rating, the total number of rentals and a rating distribution chart.
- The maximum results and popularity sliders allow to control the amount of results displayed when expanding movies.
- The suggestions mode button switches between good-suggestion and bad-suggestion expansion when expanding movies.
- The graph mode button enables or disables the simplified graph mode. This mode will be briefly explained in the following section.
- The clear graph button simply deletes every movie currently displayed in the graph area.
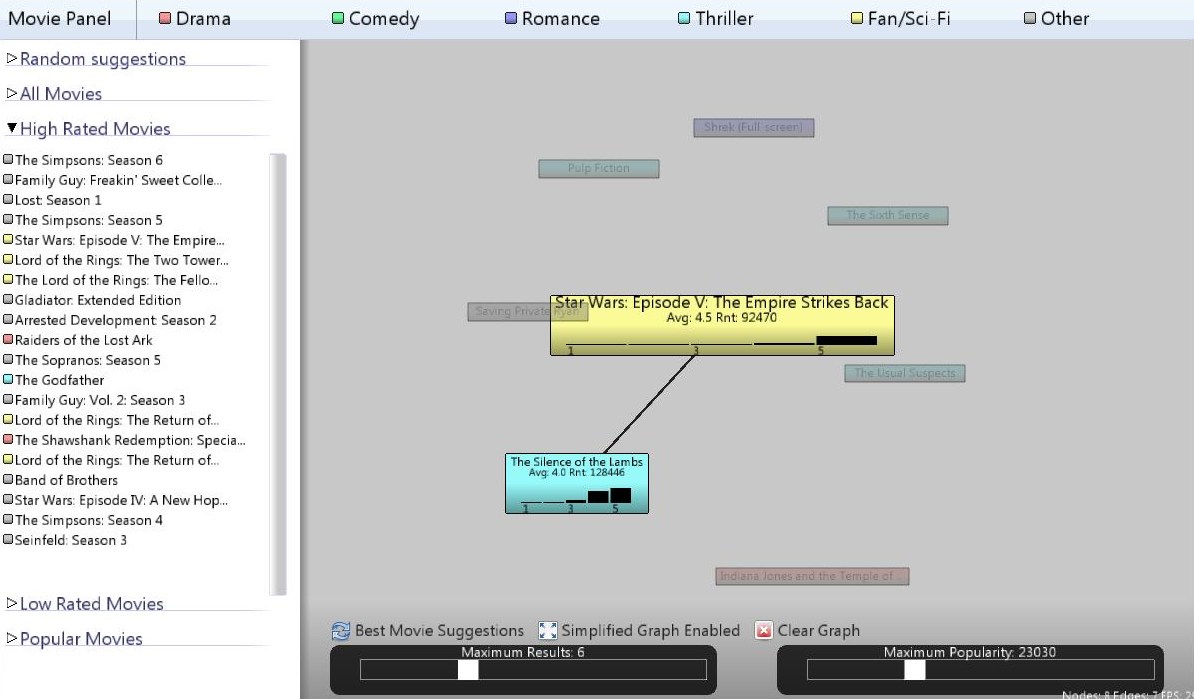
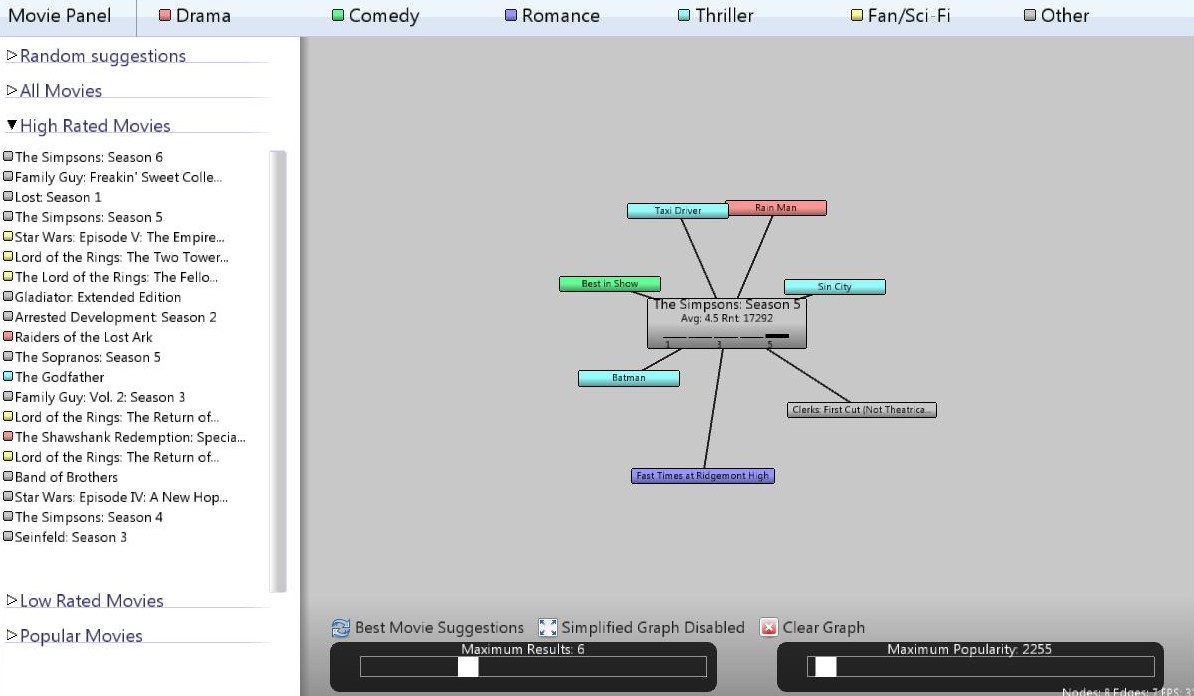
Normal vs Simplified Graph Modes
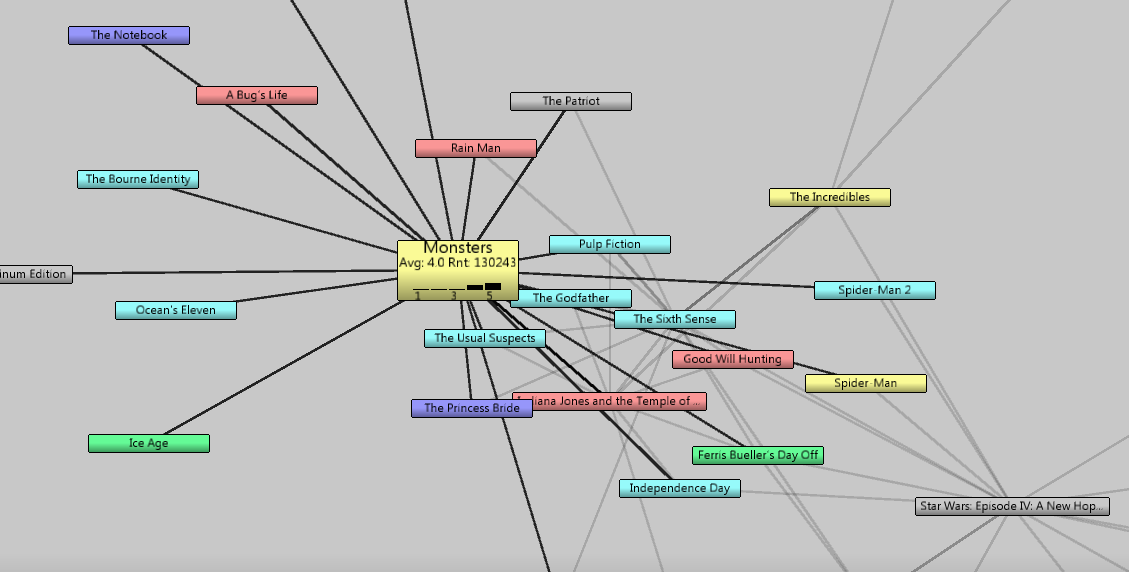
Normal graph exploration, works as one would expect. The user expands movies, and suggestions displayed for different movies get linked together as the graph grows bigger. This allows the user to see ALL of the possible links between the movies currently present in the graph. The simplified graph mode allows the user to explore the movie suggestion graph in a more streamlined way: when expanding a movie, the previously expanded movie gets shrinked back again, with the expection of movie suggestions that are common between the previous and the new selection.