Share this Page
CS491 Project 3 - Saturday Night at the Movies
For this project, we had to build an application to visualize data coming from the Internet Movie Database (IMDB). The application had to offer the user the possibility of visualizing and comparing the careers of multiple actors and directors, in a way similar to the NY Times Billboards Rankings. Data preprocessing was of extreme importance for this project, since the original IMDB text listings data had to be filtered and reorganized in order to bring it down to an acceptable size and easy-to-load format.
Data Preprocessing
The initial data parsing process extracted just the raw actor, actress, director, movie, rating, and genre information from the data files. TV shows, video games, and direct to video entires were removed. This reduced the initial 400 MB actor file to just 100 MB. The second parsing step involved reading in the parsed data files. Movie data is stored in a hashtable of Movie objects. Next the movie ratings and genres are appended to the Movie objects. For all actors, actresses, and directors movie entires are listed by a unique ID number instead of the original movie name. This reduced the actor file size from 100 MB to just 12 MB. The next step was to take the 28 genres from the dataset and combine them down to six. To accomplish this, we generated a list of the total genres that were appended to each move. Then for each genre we calculated how many other genres also appeared in the same movie. Using these list we combined genres together that had a high percentage of films with other genres. The remaining smaller genres that had fewer than a few thousand total tags or movies that had no genre listed were combined into the Other category.
The top/bottom actor, actress, and director lists were generated using the average of the movies they were in up to the decade selected. The rank is slighty adjusted based on the billing rank of the actor. If the actor has a billing rank of 1-9 their rating for that movie was increased based on how high they were ranked. Rank 10 just uses the movie rating, and a rank of 11+ would lower the rating for that movie. We would have ideally made use of the number of votes, distribution, and comparisons with the total number of voters in a particular decade. The structure to do this exists, but was not fully implemented due to time constraints.
Application Features
Application layout
The application is divided into three main sections, the toolbar, the side panel and the plot area.
- The Toolbar, on the top of the application window, exposes buttons to show or hide different side panels, and displays a legend of the movie genre categories used in the visualization. The genre legend items are actually clickable in order to enable genre filtering, as explained in the following sections.
- The Side Panel, located on the left of the application window, is the central location used for database navigation, searching and actor selection.
- The Plot Area is the area of the application dedicated to the actual visualization of actor careers. Closing the side panel will maximize the size of the plot area.
Selecting Actors
To add an actor plot to the plot area, it is enough to select him or her from the side panel listings. The side panel offers a number of different ways of performing this selection. All of the people contained in the database (actors, actresses and directors) are categorized using a number of filters, that the user can access from the side panel. The three main filter categories are best people, worst people and suggestions:
- The Best People category offers filters to the top actors, actresses and directors for each decade. The algorithm used to compute this listings has been explained in a previous section
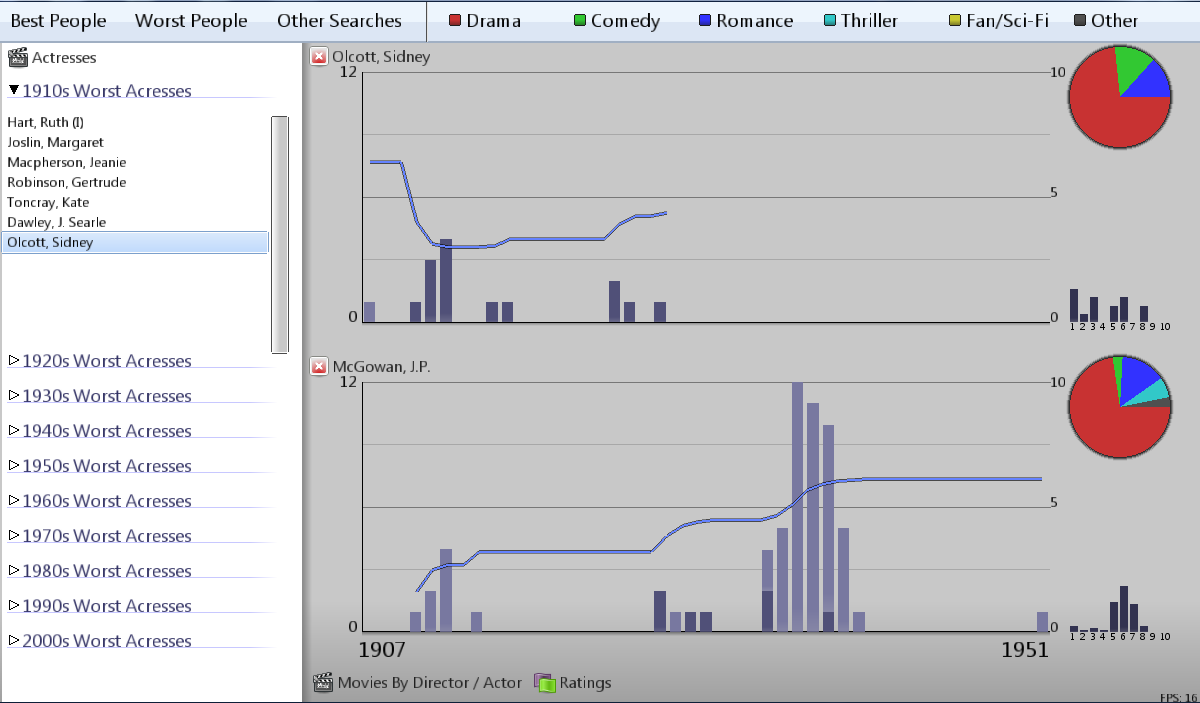
- The Worst People category works as the best people one, except it offers filtrs to access the worst people for each decade
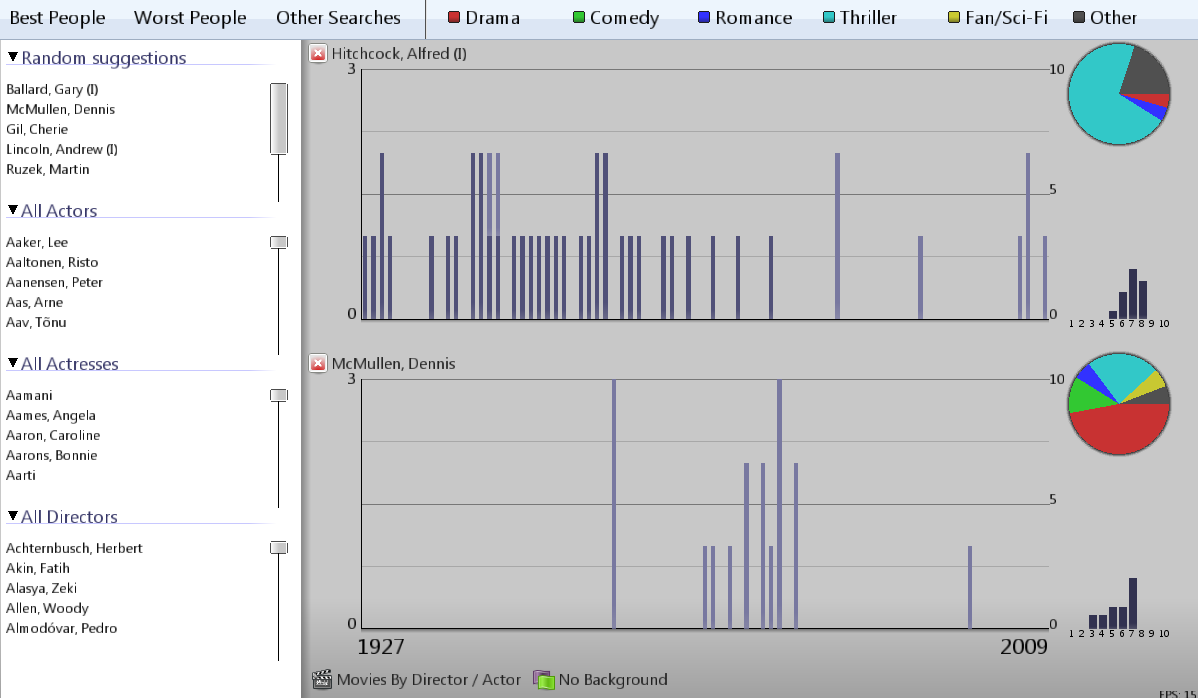
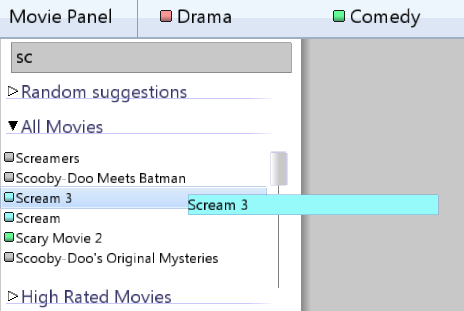
- The Suggestions category offers additional useful filters: a random suggestions filter, dynamic filters depending on the selected year or genre, and a filter to access the entire database listings.
Navigating through the filters is extremely easy. The user can expand / collapse every single filter to display its contents, and then click on the individual entries to add the specified person to the plot area. All of the filters also support real time searching: the user can start typing text at any time to have the contents of filters automatically searched for the specified string.
Configuring plots
Once one or more plots have been added to the plot area, they can be configured using the two buttons on the bottom left part of the plot area. These buttons can be used to configure the bar charts and to enable or disable the visualization of additional data on the plot.
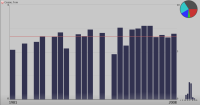
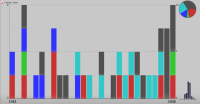
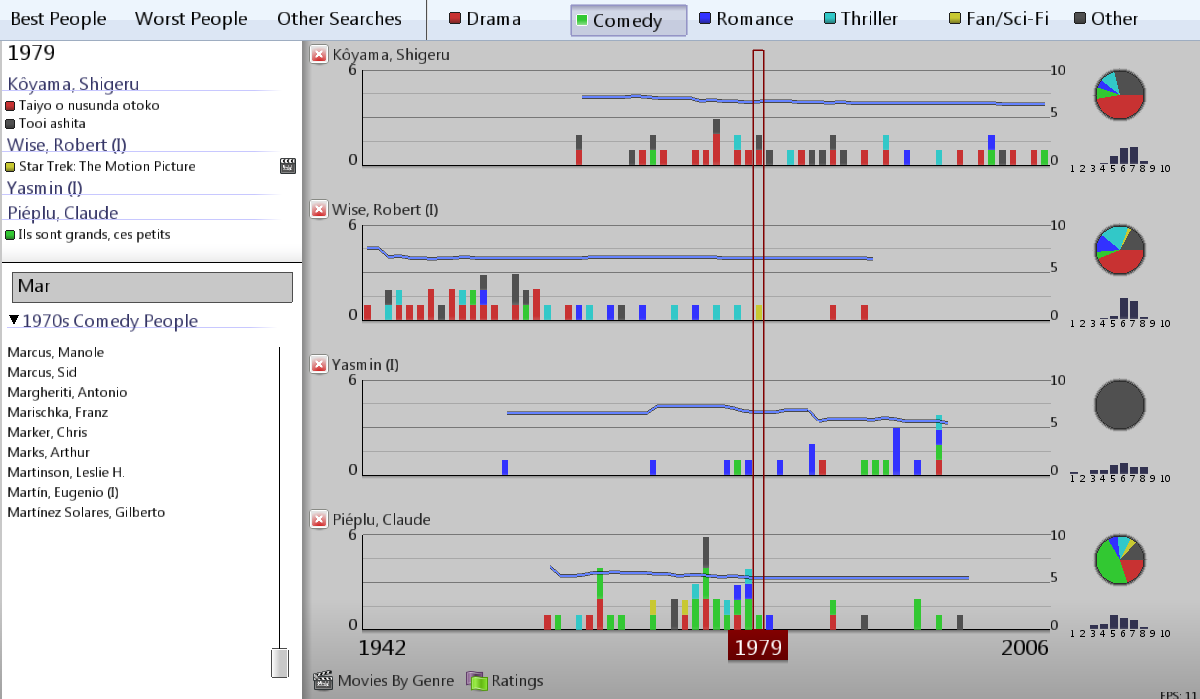
- Average ratings displays the average rating of movies for each year
- Min Max Average ratings displays the average rating of movies for each year plus the maximum and minimum movie rating for that year
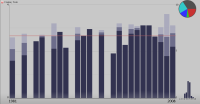
- Movies displays the amount of movies done for each year
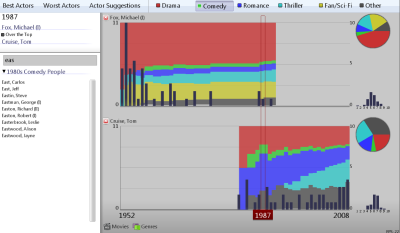
- Movies by Genre displays the amount of movies done for each year, color coded depending on the movie genre
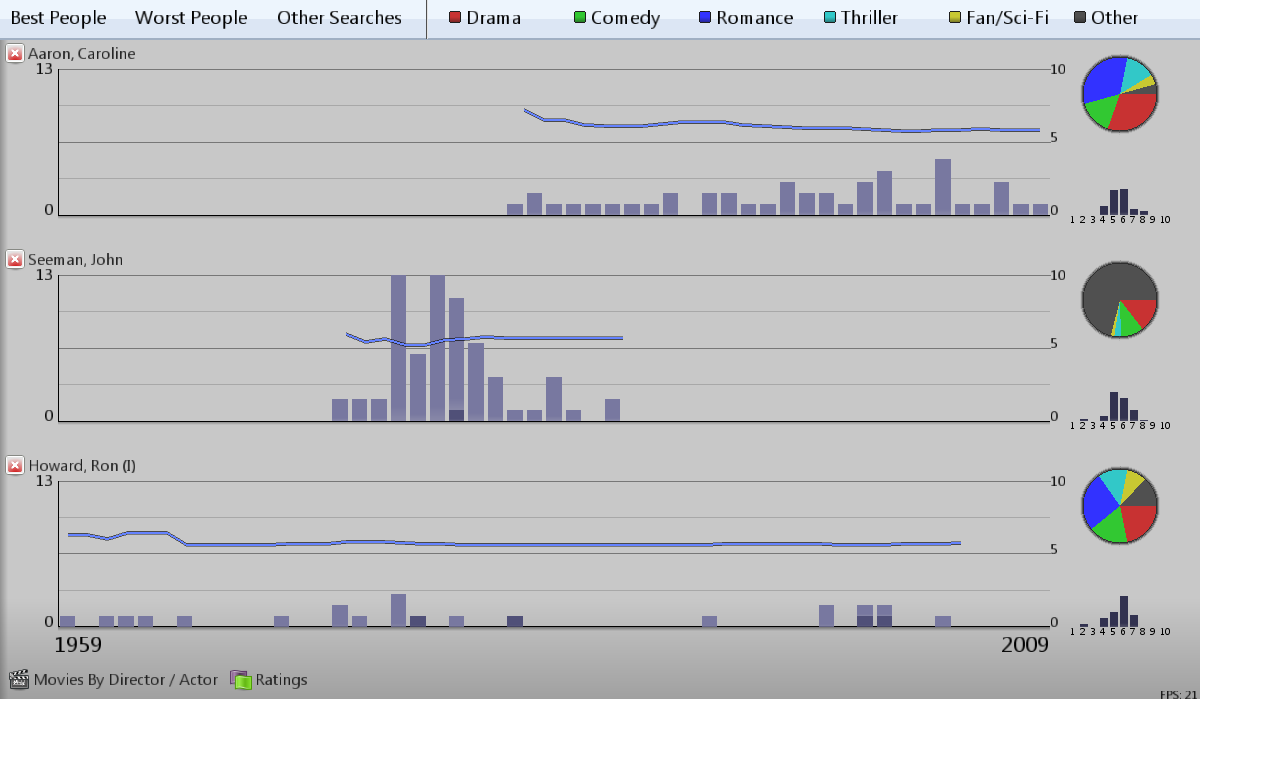
- Movies by Actor / Director displays the amount of movies done for each year, color coded depending on the fact that the current person was an acotr or a director in thet movie.
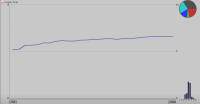
- Average Ratings plot displays a line plot showing the aggregate average ratings for the actor / director over time
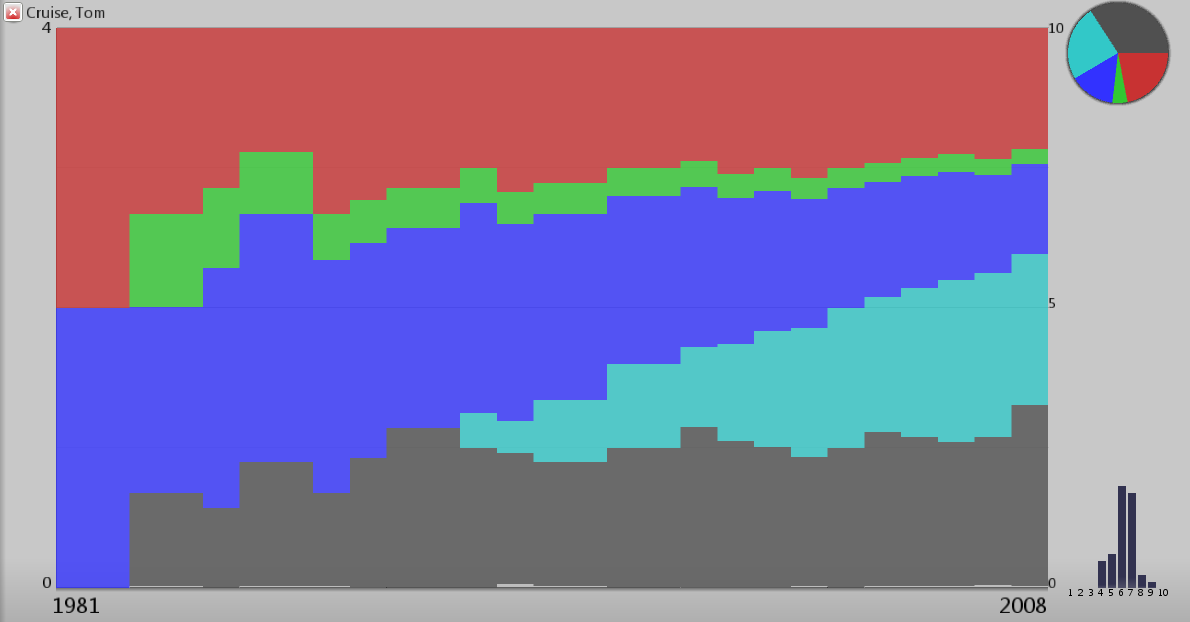
- Aggregate Genres displays the distribution of genres for movies involving the specified person over time
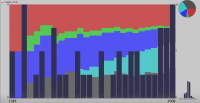
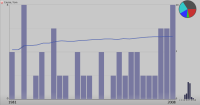
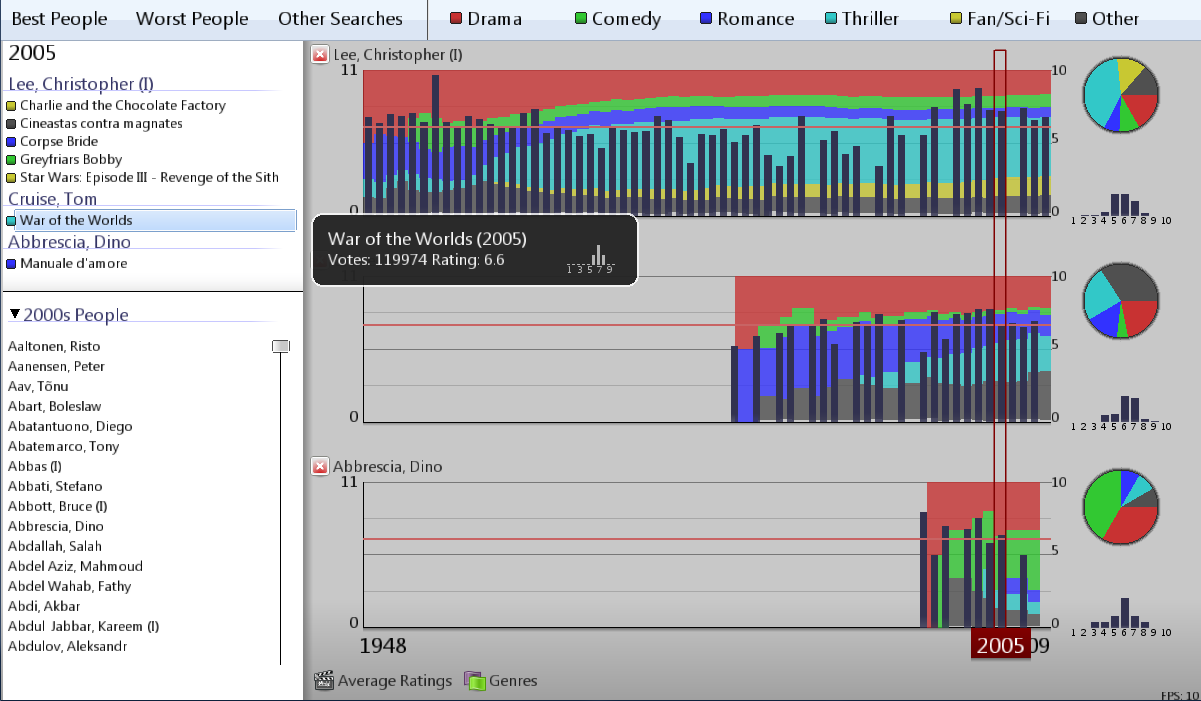
Bar charts and extra data visualizations can be overlapped to display correlated information in different formats. Additionally, at the right end of each plot, a pie chart and a smaller bar chart display aggregated information about genre and ratings distribution for the current actor / director.
Navigating time
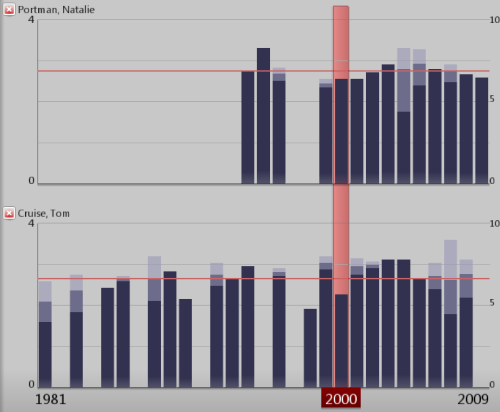
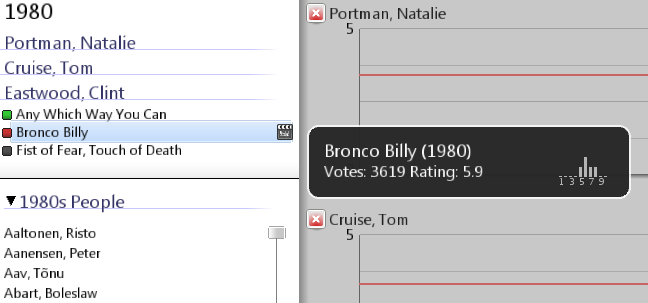
By clicking on any plot, it is possible to select a specific year. The side panel upper section will display a listing of movies done by the currently visualized people on that year. Next to each movie is a colored icon indication the movie genre, plus an icon indicating if the person was an actor or director in that movie. Hovering with the mouse on a movie will display a small tooltip panel offering some additional information for that movie, like the average rating, the number of votes on IMDB and the rating distribution plot.