
Page 18 - CMC 2019 HISPANIC MARKET GUIDE
P. 18
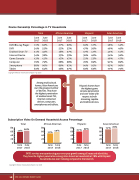
 MEDIA DEVICES
 Device Ownership Percentage in TV Households
 Total
African American
June June 2017 2018
Hispanic
June June 2017 2018
Asian American
 DVD/Blu-rayPlayer 72% 66% 67% 60% 63% 57% 58% 53%
 52% 53%
47% 50%
 EnabledSmartTV 31% 40% 28% 37% 37% 47% 45% 51%
33% 39%
GameConsole 43% 42% 42% 42% 52% 53% 46% 47%
68% 68%
Smartphone 88% 90% 89% 92% 94% 95% 95% 96%
56% 57%
36% 40%
 70% 69%
 63% 63%
    DVR
Internet Device
Computer
Tablet
June June 2017 2018
54% 55%
34% 38%
79% 79%
63% 64%
June June 2017 2018
46% 46% 54% 56% 91% 89% 77% 75%
  Copyright © Nielsen Total Audience Report—Q2 2018
Among multicultural homes, Asian Americans own the greatest number of devices. They have the highest penetration of enabled smart TVs, internet connected devices, computers, smartphones and tablets.
Hispanic homes have the highest game console penetration and over index with respect to both streaming capable and mobile devices.
        Subscription Video On Demand Household Access Percentage
80 60 40 20
0
66%
June June 2017 2018
80 60
Total
African American
80
60 51%59%
40 40 20 20
0 June June 0 2017 2018
Hispanic
61% 69% 80 60
40 20
Asian American
72% 78%
June June 2017 2018
     59%
        SVOD services are experiencing year-over-year growth among all races and ethnicities. They have the highest penetration among Asian American households at 78% with Hispanic households also over indexing compared to the total U.S.
Internet-enabled TV-connected Devices Household Access Percentage
18
Total African American Hispanic Asian American
CMC 2019 HISPANIC MARKET GUIDE
June
2017 2018
June 0
     Copyright © Nielsen Total Audience Report—Q2 2018
     100 100 100 100
