
Page 17 - CMC 2019 HISPANIC MARKET GUIDE
P. 17
MEDIA DEVICES
When describing the types of television households that exist today, the key word to consider is “choice.” Consumers have more choices than ever on how to access TV content, from the perspective of both device and delivery. The one constant throughout this change is that a television household is defined as one that can view content on a television set.
Television Distribution Status (Percentage of TV Households)
June June 2017 2018
vMVPD 1.4% 3.4% Broadband Only 4.7% 6.3%
Note: Traditional Cable, vMVPD. Over the Air, and Broadband Only breaks are mutually exclusive. Total Multichannel is the sum of Traditional Cable and vMVDP.
June June 2017 2018
2.8% 6.1% 14.7% 14.7%
Total
African American
June June 2017 2018
Hispanic
June June 2017 2018
Asian American
Traditional Cable 81.3% 77.4% 78.8% 75.5% 74.3% 69.8% 73.8% 66.2%
1.2% 3.4%
1.4% 3.2%
Over The Air 12.6% 12.9% 16.5% 16.8% 19.5% 20.6% 8.9% 12.9%
3.4% 4.4%
4.8% 6.4%
Total Multichannel 82.7% 80.8% 80.1% 78.9% 75.7% 73.0% 76.6% 72.3%
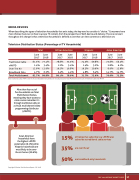
More than four out of five households are Total Multichannel homes, meaning they have access to cable content whether it’s through traditional cable or a virtual multichannel video programming distributor (vMVPD).
Asian American households have
the highest vMVPD penetration (6.1%) while Hispanic households are most likely to be over- the-air homes (20.6%).
15% 35% 50%
of homes that subscribe to a vMVPD also subscribe to traditional cable services
are over the air
are broadband-only households
Copyright © Nielsen Total Audience Report—Q2 2018
CMC 2019 HISPANIC MARKET GUIDE
17
