
Page 114 - TransportationPlanUsetsGuide
P. 114
Regional Freight System
Freight (i.e., truck) route designa-
tions are applied at the state,
regional, County, and local level.
ODOT, Metro,
Washington County, and the cities
in Washington County each have
their own designations that reflect
the needs for transporting goods
within and through the respective
agency jurisdictions. Roadways on
these routes should be designed,
constructed, and maintained to
support the efficient movement of Commercial freight on NW Cornelius Pass Road
freight. The 1999 Oregon Highway Plan identifies the State Highway Freight System. In Washington County, this designa-
tion is applied to all freeways (I-5, US 26, and OR 217) as well as OR 99W and OR 6. At the regional level, Metro identi-
fies a more detailed set of significant freight infrastructure. Metro’s Regional Freight Network in Washington County
identifies main roadways and road connectors for freight trucks, railroad lines, rail yards, marine facilities, and airports.
Truck Demand
Truck Counts
Counts of truck traffic have been taken at various locations within Washington County. These counts provide an under-
standing of truck operations within the county, but only at the points where the counts are taken. Specific path infor-
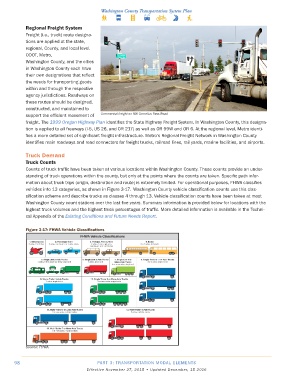
mation about truck trips (origin, destination and route) is extremely limited. For operational purposes, FHWA classifies
vehicles into 13 categories, as shown in Figure 3-17. Washington County vehicle classification counts use this clas-
sification scheme and describe trucks as classes 4 through 13. Vehicle classification counts have been taken at most
Washington County count stations over the last five years. Summary information is provided below for locations with the
highest truck volumes and the highest truck percentages of traffic. More detailed information is available in the Techni-
cal Appendix of the Existing Conditions and Future Needs Report.
Figure 3-17: FHWA Vehicle Classifications
Source: FHWA
98 PART 3: TRANSPORTATION MODAL ELEMENTS
Effective November 27, 2015 • Updated December, 15 2016