K Means Tutorial
The purpose of this tutorial is to walk the new user through a K-Means analysis beginning to end. By the end of this tutorial the user should know how to specify, run, and interpret a K-means model.
Those who have never used H2O before should see the quick start guide for additional instructions on how to run H2O.
Getting Started
This tutorial uses a publicly available data set that can be found
Seeds data set http://archive.ics.uci.edu/ml/datasets/seeds
The data are composed of 210 observations, 7 attributes, and an priori grouping assignment. All data are positively valued and continuous. Before modeling, parse data into H2O as follows:
- Under the drop down menu Data select Upload and use the helper to upload data.
- User will be redirected to a page with the header “Request Parse”. Select whether the first row of the data set is a header. All other settings can be left in default. Press Submit.
- Parsing data into H2O generates a .hex key (“data name.hex”).
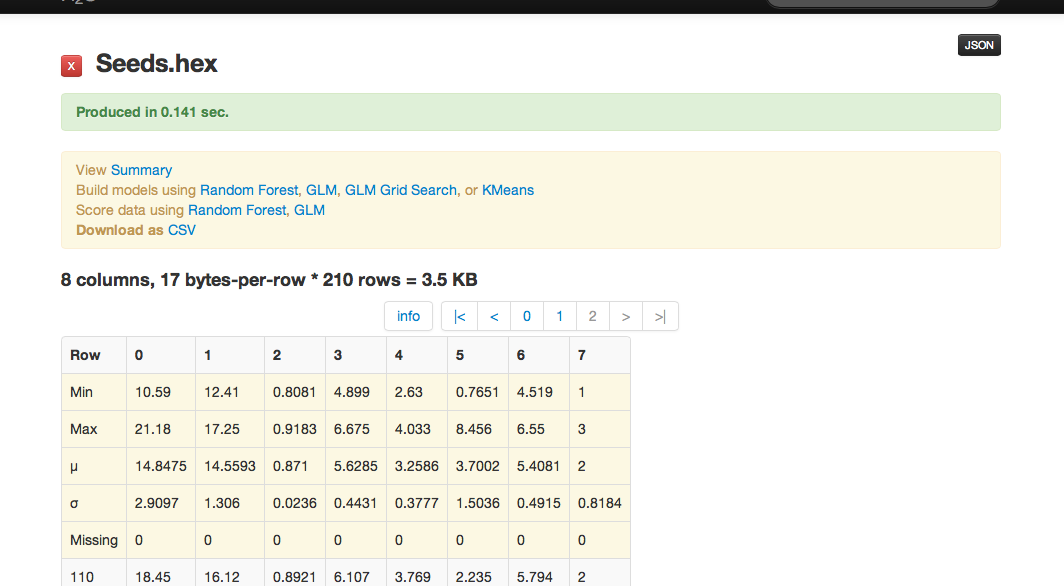
Building a Model
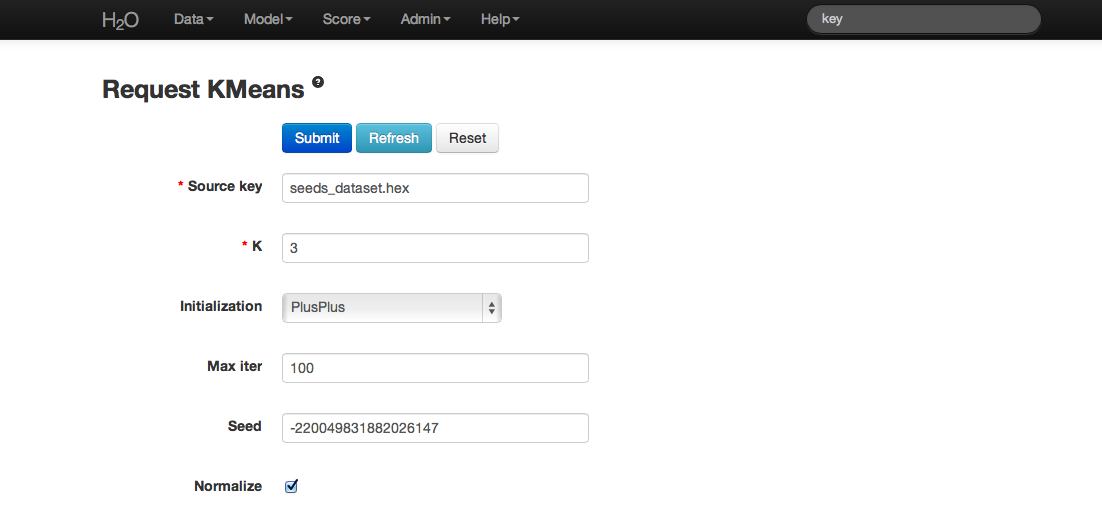
- Once data are parsed a horizontal menu will appear at the top of the screen reading “Build model using ... ”. Select K Means here, or go to the drop down menu Model and select K-Means there.
- In the field for Source Key enter the .hex key associated with the data set.
- Choose K. There is no hard and fast rule for how to do this. For this dataset K is chosen to be 3.
- Note that data can be normalized, though it is not done for this analysis.
- Specify Initialization. Plus Plus initialization chooses one initial center and random, and weights the random selection of subsequent centers so that points furthest from the first center are more likely to be chosen. Furthest initialization chooses one initial center at random, and then chooses the next center to be point furthest away in terms of Euclidean distance. No selection results in K initial centers being chosen independently at random.
- Specify Max Iter (short for maximum iterations), which allows the user to specify the maximum number of iterations the algorithm processes.
- Cols is a list of the columns of attributes that should be used in defining the clusters. Here we select all but column 7 (the a priori known clusters for this particular set).
- Press submit.
K-Means Output
Output is a matrix of the cluster assignments, and the coordinates of the cluster centers in terms of the originally chosen attributes. Your cluster centers may differ slightly. K-Means randomly chooses starting points and converges on optimal centroids. The cluster number is arbitrary, and should be thought of as a factor.
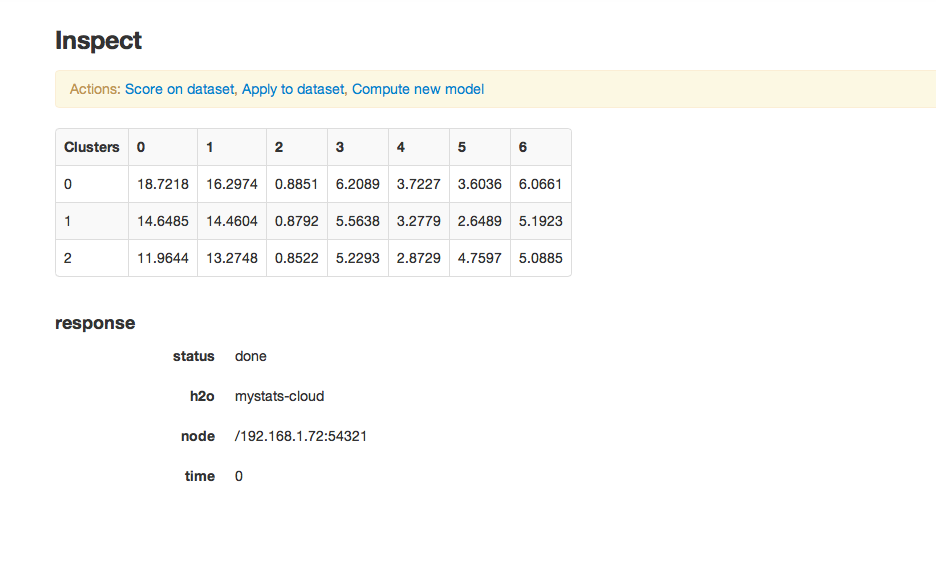
The exact model can be reproduced by entering the same seed as was originally used. This seed is
-220049831882026147
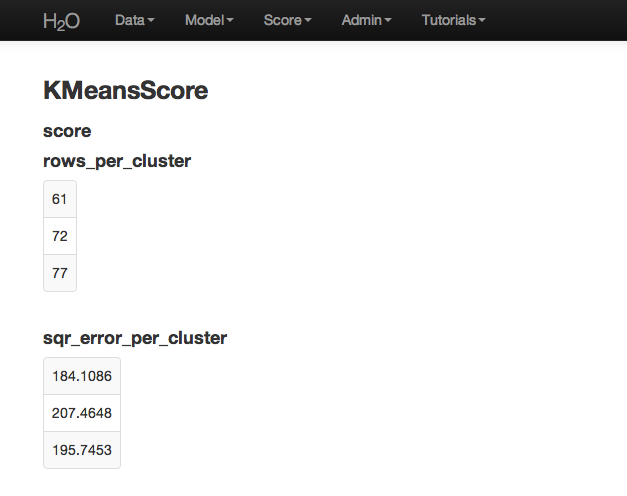
K-means Score
For further information on the model select K-Means from the drop down menu Score. Specify the K-Means model key, and the .hex key for the data set originally used.
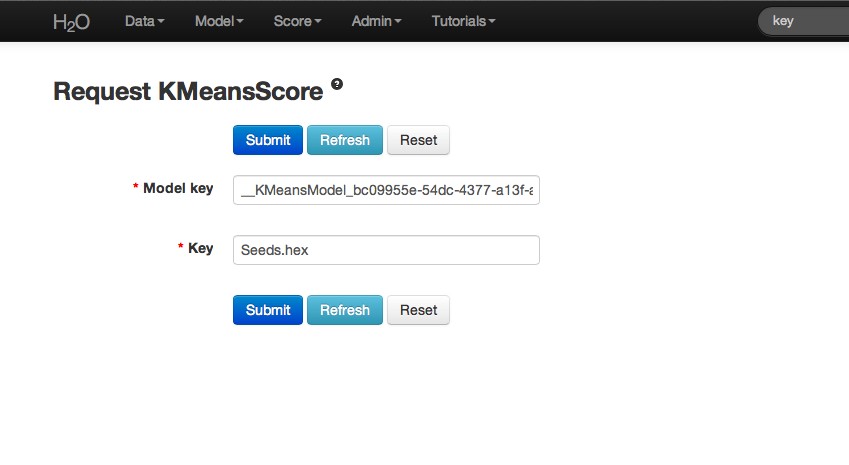
The output obtained when submit is pressed is the number of rows assigned to each cluster, and the squared error per cluster.
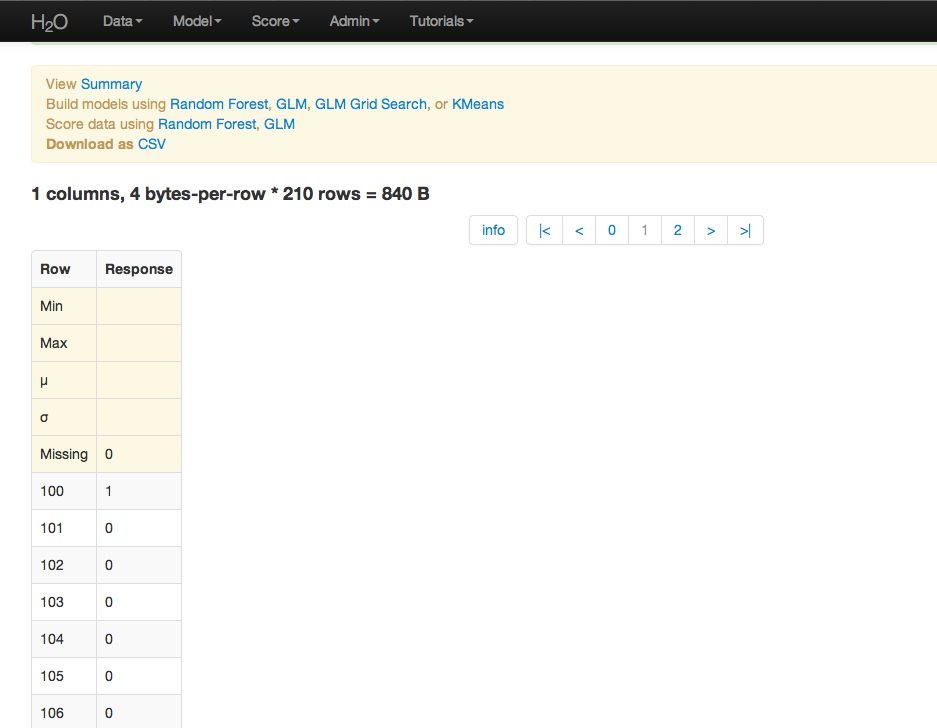
K-means Apply
To generate a prediction (assign the observations in a data set to a cluster) select K-means Apply from the Score drop down menu. Specify the model to be applied and the .hex for the data you would like to apply it to, and press submit.
Here cluster assignments have been generated for the original data. Because the data have been sufficiently well researched, the ideal cluster assignments were known in advance. Comparing known cluster with predicted cluster demonstrated that this K-Means model classifies with a less than 10% error rate.
THE END.