9.5 Data Visualization using ArcGIS Map
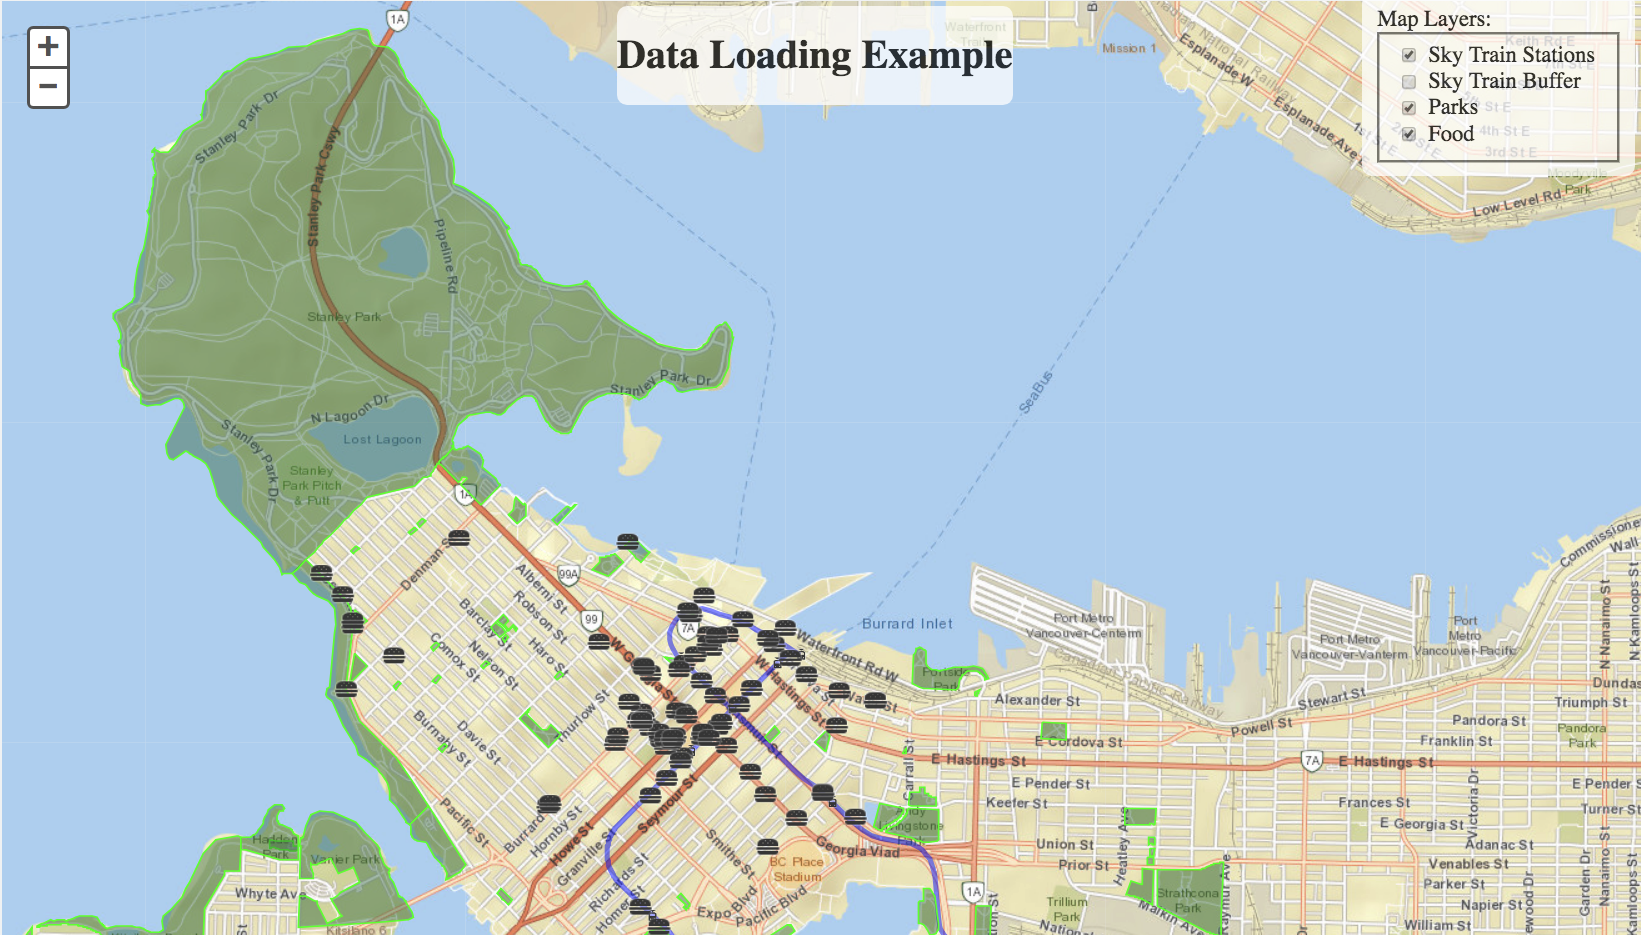
In this example, we will create a map using an Esri basemap and use the Esri JavaScript functions. In this example when a box is checked the a KML layer is loaded. When the box is unchecked, then the layer will be invisible. This is a great example of streaming real-time data to a map. While parks and Skytrain stations may not be updated frequently, this demo may be applied to real-time data. For more information on the Esri JavaScript, please refer to the ArcGIS Developers Documentation.