
Page 14 - CMC 2019 HISPANIC MARKET GUIDE
P. 14
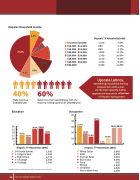
       Hispanic Household Income
6.8%
5.3%
Less than $10,000 $10,000 - $14,999 $15,000 - $19,999 $20,000 - $29,999 $30,000 - $39,999 $40,000 - $49,999 $50,000 - $59,999 $60,000+
Hispanic TV Households (000)
1,100 6.8% 860 5.3% 860 5.3%
    5.3% 11.7%
10.9% 9.9%
  41.8%
8.3%
40%
Make less than $40,000/year
EducationEducation
1,890 1,760 1,610 1,350 6,780
11.7% 10.9% 9.9% 8.3% 41.8%
                          60%
Make more than $40,000/year with the majority making upwards of $60,000/year
Upscale Latinos, representing households earning between $40-100K a year,
are the most upwardly mobile segment and account for 40percent
of Hispanic buying power.
segment and account for 40 percent 40.7%
OccupatioOnccupation
50 50 40 40
40.7% 18.4%
    30 30 25 25
31.1%
31.1%
28.4% 28.3%28.4% 28.3% 10.2%
2.1%
26.0% 26.9%26.0% 26.9%
55
00 00
30 30
       18.6%
18.6% 18.4%
20
15512.5%12 12.6% 100 1010
20
20 20
16.1% 16
.1%
   1 1
.5%
12.6%
10.2%
     2.1%
     14
Hispanic TVHHisopuasneichoTlVdsH(o0u0s0e)holds (000)
Hispanic TVHHisopuasneichoTlVdsH(o0u0s0e)holds (000)
0-8 Grade S0c-h8oGorlade School 1-3 High Sc1h-o3oHl igh School 4 High Scho4oHl igh School 1-3 College1-3 College
4+ College4+ College
2,610 2,610 2,020 2,020 4,210 4,210 4,360 4,360 3,010 3,010
White CollaWr hite Collar POM POM
Clerical, SaClelserical, Sales Blue CollarBlue Collar Farm Farm
Skilled Skilled
Unskilled Unskilled
Not in laboNr fotricnelabor force
5,040 5,040 2,990 2,990 2,050 2,050 6,590 6,590
340 340 1,650 1,650 4,600 4,600 4,580 4,580
            Copyright © Nielsen Media Research 2018 “National Universe Estimates”
  CMC 2019 HISPANIC MARKET GUIDE
