Fundamental Value returned 27.0% net of fees for the first half of 2021, handily besting the S&P 500’s 15.2% gain. The strategy has now returned 24.9% annualized since inception, outperforming the S&P 500’s 17.2% return by 7.7% annually.1


The first part of this series, Part I: Birth of a Bubble, marked the bottom in value stocks. The second part of this series, Part II: Anatomy of a Bubble, marked the top in the most speculative growth stocks. We believe this third part will mark the top in the market as a whole.
Since our last letter, a bubble restricted to the most speculative securities has morphed into a bubble in all financial assets. Today, valuations are at historical extremes in every corner of the US markets: value stocks, growth stocks, Treasuries, corporate bonds, real estate. These extreme valuations presage real returns that investors will find severely disappointing -- and likely negative -- for many asset classes over years to come.
Recap of Parts I and II.
In the first part of this series, we said:
We believe that the prospects have never been better for value investors than they are today... We are convinced that today is the day to go all-in on value.
Value stocks proceeded to soar. According to our calculations, the valuation of the median value stock has skyrocketed from the 19th historical percentile to the 86th percentile in less than a year.
2 This has been a phenomenal tailwind for value investors like ourselves. However, as a consequence of skyrocketing valuations, the pickings are now slimmer, and investors will need to be much more discerning going forward. Whereas just a few short months ago there was a cornucopia of quality companies trading at depressed valuations, now we must search long and hard to find a few diamonds in the rough.
In the second part of this series, we called out the bubble in the most speculative securities in the market. We looked at its anatomy, and how investors, in search of fortune, had reached higher and higher up the levels of the speculative pyramid, each level more rickety than the last.
- Transcenders. Transcendent businesses that earn enormous and growing profits. They seemed to us “neither especially cheap nor outrageously expensive,” and so formed the solid base upon which the rest of the pyramid teetered.
- Contenders. Here every investor hopes to find the next Apple or the next Facebook. These firms build promising technology and deliver compelling products but sported “absurd” valuations, leading us to point out the difference between “a great company and a great investment.”
- Pretenders. At this level, we found companies “devoid of solid business models, meaningful proprietary technology, or even working products.” They are, however, skilled at mimicking the signals of other more successful companies. Pretenders found many buyers for their securities in the “overly credulous” marketplace.
- Pump-and-dumpers. At the apex of the speculative pyramid are stocks which are merely “abstract vehicles for gambling;” the company underlying the stock has virtually no role. Some of these stocks aren’t even really businesses at all -- they don’t have working phone numbers or file annual reports. This includes “Ponzi parties,” where traders on social media coalesce around a stock and drive it higher before it inevitably collapses, as well as SPACs, black-check companies that provide a convenient way to speculate on an IPO without the annoying distraction of an actual operating company.3
We mentioned several stocks at each level of the pyramid, and the returns have been exactly as one would expect. Today, the transcenders are down an average of less than 5% from their respective highs (Apple, Amazon, Microsoft, Facebook, Google). The contenders have collapsed 38% (Tesla, Zoom, Teladoc). And the pretenders (Nikola, Vaxart, Kodak, MicroStrategy, SOLO) have plummeted 70%.
We were short all the contenders and pretenders we talked about (and more), excepting SOLO. We didn’t top-tick all of these stocks, obviously. But we believe many of these stocks still have much further to fall.
The everything bubble.
Despite the carnage in the most speculative end of the market, major US equity indices have continued ever higher, setting dozens of new all-time highs in 2021. Earnings are at record highs as well, but share price gains have
more than doubled earnings gains over the past thirty years. Thus, every valuation metric is at or near all-time highs.
The table below paints a grim picture.
4 It shows three different ways of calculating the yield on equities. It shows three different government interest rates (yield on cash, 10 year Treasury yields, and the real return of 10 year Treasury Inflation-Protected Securities). And it shows the credit spreads on AAA and CCC bonds, the incremental yield compensation investors receive over Treasuries for buying the highest quality corporate bonds and junk bonds, respectively.
Pay close attention to the column on the right, which shows the historical percentile for that particular yield.
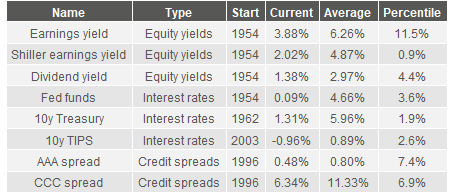
All eight of these rates are within shouting distance of their all-time lows. This isn’t a bubble in one particular asset class. It’s an everything bubble.
This everything bubble is an intentional result of Fed policy. Perennial interest rate repression and trillions in quantitative easing have driven investors to bid up assets everywhere. When real returns on cash and risk-free government bonds are unattractive -- or deeply negative, as they are now -- investors are penalized for saving, losing purchasing power over time. This encourages investors to reach for yield, and take on incremental duration and credit risk. The phenomenon is especially pronounced in long-duration assets, which are most sensitive to interest rates, such as long-term bonds, growth equities, and cryptocurrencies.
Paying extreme valuations today could result in acceptable returns if future earnings were to increase from today’s levels at above-average historical rates. However, this is exceedingly unlikely. We aren’t experiencing high valuations off of a depressed earnings base. Instead, we see the opposite: peak multiples on top of peak earnings on top of peak profit margins.
Valuation growth, sales growth, and earnings growth from today’s levels are all likely to be tepid. Real GDP growth should come in around 1% going forward, as
productivity growth has averaged 1.3% for the last decade, and the working age population in the US is
shrinking for the first time in history. Corporate revenues will be roughly in line with GDP over time, and thus real top-line growth is likely to be anemic. Corporate profit margins are near
record highs, 40% higher than their long-term average; a surge in earnings from here would require unending economy-wide margin expansion, rather than the long-term mean reversion that has -- and should -- characterize this series. Recent government
deficits -- which end up as a surplus for corporations and individuals -- have gone well beyond their all-time highs (excepting only WW2). This tailwind for earnings will be moderating at best and plummeting at worst.
Passive investors are likely doomed to a long period of disappointing returns. Many active investors will have a tough time too; even looking under the hood of the market won’t help much as much as it has helped in the past. For example, at the height of the tech bubble in 2000, growth stocks were as expensive as they are today, but value stocks were very cheap -- the valuation of the median value stock was in the 7th percentile. Thus, in the five years after January of 2000, the Pure Value Index more than doubled even while the Russell 1000 Pure Growth Index declined by more than half, providing some respite for discerning investors as the major indices endured a bear market. In contrast, today the valuation of the median growth stock is in the 98th percentile, and the valuation of the median value stock is in the 86th percentile. The expensive end of the market is incredibly expensive... but so is the cheap end. The everything bubble makes the job of stockpickers very difficult.
With markets priced for perfection, any number of things could trigger a severe bear market. Covid vaccine escape could become significantly worse, necessitating new lockdowns. A potential government shutdown
looms in October as the debt limit approaches. Regulatory risks are
increasing for the tech giants and their enormous profits. A domestic slowdown in China could derail the global economic recovery, or escalating tensions with the US could bring about a wave of deglobalization. Tax
increases on corporations could hurt earnings, or changes to capital gains treatment or estate taxes could cause individuals to sell assets. Record-high corporate profit margins could begin to revert to their long-term average. The Fed could withdraw its support too suddenly. Or the Fed could withdraw its support too late, after inflation is already entrenched.
It’s this last risk that we’d like to focus on for the rest of this letter, because we believe that inflation is probably here to stay. Our valuation concerns are not predicated on inflation rearing its ugly head; only the smallest stumble is necessary for prices to fall off a cliff when the market is poised on a precipice. But the return of serious and persistent inflationary pressures seems more and more likely by the day.
The inflation that’s here.
There are many ways to measure inflation, but today, they all tell basically the same story: inflation is running at a dangerously high level, its highest in 30 years. The last time core CPI was above its
current level of 4.0%, the year was 1992.
The great debate is whether the inflation we are seeing is transitory or permanent. Is this a one-time increase in the price level, and thus core inflation will be quick to moderate back below 2%, where it’s been for most of the past generation? Or has inflation become permanent, and thus we’ve reached a new normal where self-perpetuating inflation accelerates in a vicious cycle?
In search of an answer, we’ve seen much
slicing and dicing of official inflation statistics: whether to use CPI or PPI or PCE; whether to use the index itself or the core index (exclude volatile food and energy), or the trimmed mean (exclude outlier components), or the median component; whether base effects from the depressed pandemic economy from a year ago have misleadingly raised today’s numbers; whether temporary pandemic-driven supply chain issues are behind the surge in prices.
Clearly there are some transitory elements to recent price increases: used car
prices may or may not be permanently higher, but they won’t continue to go up over 40% every year. However it is also clear there are more price increases coming down the inflationary pipeline that have yet to hit official statistics. The two biggest sources will be shelter and wages.
The inflation that’s coming.
Shelter is the largest component of the CPI, constituting about a
third of the headline index (and more of the core index). And the cost of shelter is way up. Home prices are soaring: the Case-Shiller National Home Price Index
rose by a record 18.6% YoY. Rents are following: only halfway through 2021, Apartment List National Rent Report reported that rental prices had already
increased 11.4%.
Yet the shelter component of CPI
rose by a measly 2.8% YoY in August. The shelter component lags the reality on the ground due to the nature of the real estate market and the CPI calculation
methodology. New leases are signed only intermittently, and the data underlying the shelter component is collected less frequently than other components. Furthermore, the shelter component is not based on actual prices paid, but instead
based on two surveys: rent paid by home renters (how much do you pay for rent?), and the rent theoretically paid by homeowners (how much would it cost to rent your home?), called “owner’s equivalent rent.” These surveys appear to be severely out-of-date, painting a much less dire picture of shelter inflation and core inflation than the true reality. Government economists at Fannie Mae
predict an acceleration to around 4.5% YoY growth in shelter CPI soon, with risks to the upside.
The 15-25% annualized pace of recent gains in home and rental prices is unsustainable, but the pressure is not going away anytime soon. There’s a shortage of housing stock, partially due to the
dearth of new construction since the housing bubble burst in the mid-2000s. Vacancy rates are at
lows not seen since the 1980s. The shortage will take many years to be alleviated. Shelter will soon be dragging inflation statistics up rather than artificially depressing them.
Wages are another source of coming inflation. Wages are not a direct input into consumer price indices since they are a cost of production rather than a price paid by consumers. But increasing wages can lead to increasing prices, which can lead to increasing wages, ad infinitum in a self-reinforcing loop; this is called a
wage-price spiral. And the evidence is clear that workers are demanding -- and getting -- wage increases to an extent not seen in decades.
While there’s still a distressing number of people unemployed (8.5 million), that’s actually
exceeded by the number of open jobs (10.5 million as of July). Job openings are completely off the charts: 10.5 million open jobs is an astonishing 48% higher than the previous record of 7.1 million from when the economy was humming along at full speed in 2018. Workers are so confident in the economy and job market that they have been
quitting their jobs at record rates. Small employers are
desperate to hire. The NFIB’s survey of small businesses is off the charts on nearly every hiring and compensation metric. They found record highs in the percentage of firms planning to add jobs, finding no qualified applicants for open jobs, increasing compensation, and planning compensation increases. Nearly 50% of small business owners reported job openings they could not fill, a record more than double the 48-year historical average.
Pandemic-era unemployment benefit expansions have likely caused significant distortions in the labor force, inducing both elevated unemployment and elevated job openings. In the most recent BLS jobs report, there were
no job gains in the leisure and hospitality sector, but pay
spiked 12.8% YoY. It’s hard to reconcile all this data with the Fed’s view that there is still so much slack in the labor market that the economy is still demand-deficient and needs massive stimulation. With unemployment benefit expansion programs
expiring, millions of people should be reentering into the labor force. Fortunately there appears to be more than adequate job availability for all of them.
Furthermore, there are even larger economic forces at play. Some disinflationary forces will persist: automation isn’t going away and may be accelerating. But to blithely assume that all the forces that have capped wage growth in the past will continue to persist is naive. We think a significant part of the tightening of the labor equation is structural rather than cyclical. Policy changes that favor labor and address income inequality are becoming a political priority. There also appears to be a pandemic-driven shift in mindset: American workers are simply much
less content to work long hours in low-wage, low-status, in-person jobs. The number of people expecting to work past age 67 fell to a
record low. Employers will have to more handsomely compensate workers, especially if the social safety net continues expanding or merely stays at current levels. We expect US labor force participation to remain
stubbornly low. This will frustrate policymakers attempting to reach the elusive goal of “full employment,” and fiscal and monetary policy will find it is pushing extremely hard on a string.
Finally, secular growth in the available pool of labor appears much closer to its end than its beginning. There has been an enormous
influx of working-age women into the US workforce, with participation rising from 42% in 1960 until plateauing around 75% in 2000, where female participation appears to have reached a new normal. And, due to falling immigration and fertility rates, the working age population in the US as a whole is barely growing and will soon be
shrinking. This baby bust is nearly universal in developed countries; in the OECD, the fertility rate is 1.6 children per woman, well below the 2.1 needed to maintain population levels. China’s
fertility rate in 2020 was an astonishingly low 1.3 and is falling rapidly. Over the past few decades China has been exporting wage disinflation across the world, as a billion Chinese cheap laborers were introduced to the global economy in an economic eyeblink. This process will also slow down, especially if China is as serious as it appears to be about its strategic shift to
“common prosperity” over unchecked crony capitalism.
The bargaining power of labor is increasing. However, the most recent
reading of the Atlanta Fed’s Wage Growth Tracker shows only a 3.9% YoY increase -- strong nominal growth and post-financial-crisis highs, but not keeping pace with inflation. We hope -- and expect -- that labor market tightness will soon lead to rising real wages, especially for lower-skilled labor. Wage growth for low-skill jobs has been persistently and substantially below that for high-skill jobs for several decades. But the last three months have shown low-skill wage growth exceeding high-skill wage growth for essentially the first time since data began in the late 1990s.
An increase in real wages for workers is unquestionably beneficial to society. But it will also stoke consumer price inflation, as lower-wage workers spend a higher percentage of their income on consumption than higher-wage workers and the owners of capital. And it will pressure corporate profits. The share of GDP that goes to
labor has declined from 64% in the 1950s to a low of 59% in 2010, which has boosted corporate profit margins as employees have garnered a smaller proportion of revenue. Labor share of GDP has since been gaining slowly since 2010 and appears likely to climb further, pulling inflation up with it.
We bring up shelter and wages to counter the Fed’s narrative that the data indicates that inflation is a transitory effect of the pandemic. Some components do overstate the likelihood of persistent inflation, but others do not yet reflect underlying inflationary pressures.
While we do think this was important to explain, discussing inflation statistics ad nauseam misses the forest for the trees. The real reason that inflation is likely to persist is the paradigm shifts in both fiscal and monetary policy.
This time is different.
There are many possible sources of inflation. One particularly pernicious and persistent source derives from a government continuously spending more than it takes in in taxes. Deficit spending causes aggregate demand for goods and services to exceed aggregate supply, resulting in an increase in the price level. This increase can become self-perpetuating if people do not believe that the government will at some point restrain deficit spending and/or pay back its debts in real terms. Inflation expectations rise, and consumers lose faith in the currency to retain its value. They see perpetually rising prices and thus pull forward their spending plans to avoid paying more in the future. Money becomes a hot potato, spent as soon as it is received. Saving for the future becomes counterproductive. Higher inflation begets higher inflation.
To gain back fiscal credibility once lost is not an impossible task, but it is a herculean one. It requires austerity -- some combination of higher taxation and lower spending. It requires raising interest rates in order to incentivize saving and risks causing a deep and self-inflicted recession. All of this requires immense and rare political willpower.
In the US, we’ve enjoyed decades of low
consumer price inflation. In fact, since the financial crisis, most economists have been more worried about inflation being too low than inflation being too high -- deflation is dangerous as well. Thus, people have largely forgotten the scourge that is high and persistent inflation, and the horror of fighting against it.
But the United States has had to wage a battle against inflation before. In the 1970s and early 1980s, the CPI grew as much as 14% YoY. This inflationary episode was not driven primarily by excessive deficit spending and monetary growth, but instead by a plethora of supply-side shocks (wage and price controls, oil crises, closing of the gold window). Nonetheless, once inflation became entrenched, it became the most important issue of its time. It was the
item of most importance to voters in 1980 -- when unemployment was
higher than it is today. Ronald Reagan’s winning presidential campaign was focused on his determination to bring inflation under control no matter the cost. Writers at the time called inflation “the cancer of modern civilization, the leukemia of planning and hope.”
To fight inflation, the chairman of the Federal Reserve Board, Paul Volcker, was forced to institute an extremely tight monetary policy on a scale unimaginable today. The
federal funds rate, an overnight interest rate controlled by the Fed, topped out at over 19% annualized. (Today it is at 0.09%.)
This tight monetary policy caused a brutal double recession. Unemployment peaked at over 10%, worse than during the depths of the financial crisis. And the whole period was extraordinarily painful for investors.
Bonds and stocks declined in tandem during the eight year period of high and rising inflation from March of 1973, when inflation breached 5% for good, until June of 1981, when inflation finally peaked. Holders of 10 year Treasuries over those eight years experienced a dismal real total return of -38%. Holders of the S&P 500 over those eight years experienced a -17% real return.
This might be surprising. Stocks are real assets -- they should be able to preserve their real earnings power by increasing their output prices as their input prices increase. And during this period, real S&P 500 earnings did in fact increase by 11%. But this could not overcome the effect of plummeting valuations. As interest rates rise, investors often apply a higher discount rate to future cash flows. This higher discount rate means the net present value of future cash flows is less valuable, reducing valuations and causing negative real returns even if earnings are increasing.
Eventually, extremely tight monetary policy did have the desired effect: inflation was tamed. Tight monetary policy encouraged saving over consumption, and most importantly, earned the Fed credibility. Investors and consumers came to believe that the Fed would do whatever was necessary to rein in inflation, however painful.
Over the past forty years, the United States has been cashing in on this hard-won credibility. The 10 year Treasury yield has fallen from 15.8% to 1.4%. Falling interest rates have powered an unending bull market in financial assets due to the discount rate effect. Since inflation peaked, holders of 10 year Treasuries have made 7x their money in real terms, and holders of the S&P 500 have made over 30x. Congress has been able to run larger and larger budget deficits. The Fed has been able to backstop the financial system with larger and larger interventions. And they’ve been able to do this with impunity because of the credibility to the claim that American institutions can and will act preemptively to contain inflation.
Since Richard Nixon ended dollar convertibility to gold in 1971, there’s been nothing backing the US dollar and holding inflation in check except this faith in American institutions to restrain the dollar’s supply. This faith should be one of our most treasured assets.
We are in grave danger of losing it.
The monetary side.
Monetary policy has become more and more accommodative since the tight monetary policies of the early 1980s. Thus far, this has not caused a dramatic rise in inflation, leading many to become complacent. They imagine that it might not only be possible to run perennial easy-money policies, but to run perennially
easier policies without consequence. This is self-evidently false.
Over time, the Fed has increasingly suppressed interest rates, monetized the national debt, and grown the money supply.
From 1960 through the end of 2008, the fed funds rate essentially never dropped below 1%. Since then, the fed funds rate has been under 1% nearly 80% of the time. In fact, it’s been effectively zero -- less than a quarter of a percent -- 66% of the time.
From 1970 through the end of 2008, the Fed
increased its Treasury holdings by $420 billion. That $420 billion was only 4% of the net increase in publicly-held Treasuries; over those four decades, the vast majority of the increase in federal debt was absorbed by the public, rather than by the Fed. Since then, the Fed has increasingly dominated the market for Treasury securities. Finding that short-term interest rates of zero were not stimulative enough for their designs during the financial crisis, the Fed introduced quantitative easing. Conventional monetary policy involves exchanging relatively risk-free short-term government debt for base money to target a short-term interest rate; QE involves the purchase of riskier, longer-term assets, driving up the price of risk assets and increasing the money supply.
During the six post-GFC years from 2009 through 2014 when the Fed was conducting its initial series of QE programs, the Fed added $2.3 trillion of Treasuries to its portfolio, 36% of net Treasury issuance during the period.
Then the pandemic hit. From the end of 2019 through the second quarter of 2021 -- less than two years -- the Fed added another $3 trillion of Treasuries, absorbing a full 58% of the enormous net Treasury issuance during the period. The Fed now holds $5.6 trillion of federal debt on its balance sheet -- a full 20% of total outstanding debt, up from 4% pre-QE.
As mentioned above, the last time core CPI was above its current level of 4.0%, the year was 1992. At that time the 10 year Treasury yielded 6.7%, and the fed funds rate was 4.1%. Today the 10 year yields 1.26% and the fed funds rate is 0.1%. Not only that, but the Fed persists with $120 billion in monthly asset purchases. It doesn’t
project to begin reducing the size of those purchases until later this year. It doesn’t project to finish buying bonds until some time in 2022. And it doesn’t project to begin raising interest rates until 2023.
This is easy monetary policy on a scale that would have been utterly unimaginable just 15 years ago, and it continues in the face of a roaring economy. Annualized real GDP
growth last quarter of 6.6% was higher than any pre-pandemic quarter since 2003. The economy is now larger than its pre-pandemic size. Inflation is running at 30 year highs. To stimulate the housing market, the Fed purchases $40b of mortgage-backed securities every month, despite housing prices currently rising at 18.6% YoY, and the
median sales price for new houses hitting new all-time highs relative to
median household income.
Recent monetary policy is not only dramatically more stimulative than past monetary policy, it is also different in kind. The Fed has recently made several explicit policy changes; some are merely likely to bring about higher inflation, while others are specifically designed to bring it about.
The Fed has long had a dual mandate to maintain stable prices and maximum employment. These goals are often in conflict: easy monetary policy promotes maximum employment, while tight monetary policy keeps inflation in check. Since Volcker, the Fed has preempted any upside risks to inflation by initiating a tightening cycle whenever the economy was at risk of overheating because maximum employment had been reached or inflation approached or exceeded its 2% target. To us, this framework makes abundant sense. Monetary policy acts with a long lag, so better to tighten early and slowly to avoid overheating in the first place rather than wait until inflation becomes a problem and then slam on the brakes. This framework keeps inflation expectations firmly anchored, and maintains Fed credibility.
However, according to the Fed, the framework has worked too well at containing inflation since the Great Recession. As a result, in 2020 the Fed introduced a
new framework called "average inflation targeting." The goal is now for inflation to average 2% over the long term, so inflation will be allowed to overshoot 2% to compensate for periods when it was below target. Additionally, the Fed will approach employment asymmetrically: the Fed will loosen monetary policy when the economy is struggling and unemployment is higher than its natural rate, but will not tighten policy when the economy is overheating and unemployment is lower than its natural rate.
Thus, in the future the Fed will be behind the curve on inflation by design. We view this as extremely dangerous. It increases the likelihood that the Fed will find it politically and economically infeasible to tighten policy. It increases the risk of a disorderly normalization of policy where the Fed needs to slam hard on the brakes. And it increases the risk inflation expectations will become de-anchored as the public endures a period of intentionally-fostered above-average inflation. It also risks exacerbating economic cycles. In sum, the larger the party and the drunker the crowd, the harder it is to take the punchbowl away, and the worse the hangover will be in the morning.
Furthermore, the Fed has begun to consider goals
outside its traditional dual mandate. It has expanded its definition of maximum employment to include “broad-based and inclusive” job gains, taking into account disparities between the unemployment rates of minority groups, pay gaps between high- and low-wage workers, etc. The Fed is also seeing pressure from politicians to use the Fed’s powers to combat
climate change.
Addressing societal ills like income inequality
5 and climate change is a worthy goal. However, the Fed is uniquely unsuited to these tasks. First of all, the Federal Reserve Board is specifically designed to be independent and unaccountable; the Board needs to be insulated from politicians and the voting public so they can make the hard and often unpopular decisions necessary to defend the nation’s currency. By implementing politically contentious social programs, they risk their independence and their bipartisan legitimacy. Second, the Fed wields powerful but extremely blunt instruments. Other institutions are far better equipped to address specific policy goals, and can do so without risking the economic stability of the country in the process. The Fed’s mission creep bodes ill for its long-term credibility on its all-important core dual mandate.
In making its case for high-but-transitory inflation over the past year, the Fed has time and again pointed to long-term inflation expectations remaining well-anchored according to both survey- and market-based data. If we look at some of the most popular expectations measures and look at their current readings relative to the past decade, we see a pretty consistent story. As one would expect, short-term expectations are at or near highs: for one-year inflation expectations, the University of Michigan’s survey is in the 99th percentile, the Conference Board’s is in the 100th, and the Fed’s own
survey is at an all-time high.
6 Medium-term expectations are also high: the Fed’s 3-year is in the 100th, the UM’s 5-year is in the 91st, and the breakevens priced into 5-year TIPS yields are in the 97th.
Expectations are well-anchored relative to recent history only if you look out to the long term. The 5-year, 5-year forward breakeven rate priced into TIPS -- i.e., inflation expectations for the 5-year period that begins 5-years hence -- is currently at 2.2%, the 54th percentile over the past decade.
This is the remaining bulwark in the Fed’s intellectual defenses. It seems a flimsy thing on which to rest one’s hat when the hat is the fate of the world’s reserve currency. Expectations would need to rise only about 1% to set all-time highs for the series. How many more months of >5% CPI inflation would we need to see long-term breakevens rise 1%?
It’s worth contemplating what the Fed’s options would be if there was such a psychological shift among consumers and investors. It could of course take the easy way out and continue with its zero interest rate policy and QE, risking total loss of credibility and de-anchored expectations in the process.
Or it could take seriously its
promise to “respond and use our tools... if sustained higher inflation were to become a serious concern.” In that case, the Fed would have to hasten the QE taper and raise rates considerably sooner than expected. In capital markets priced for perfection, this would cause dramatic dislocations. It would likely foment conflict with the Biden administration, and it could very well cost Chairman Powell his job.
Would the Fed be willing to do this? It would be very awkward to suddenly tighten policy given their promise of slow and orderly normalization; it would be very awkward to put the brakes on when there are still 5.5 million
lost jobs and minority unemployment rates remain
elevated; it would be very awkward to admit that the current bout of inflation is persistent given the Fed’s insistence that it is not. For the Fed to admit it had been so wrong is an additional credibility threat in and of itself.
The fiscal side.
Federal government deficits as a percentage of GDP have been trending larger since World War II. Each increase along the way has not caused a dramatic rise in inflation, leading many to become complacent. They imagine that it might not only be possible to run perennial deficits, but to run perennially
larger deficits without consequence. This is self-evidently false.
Recent deficits are dramatically larger than prior deficits, and debt as a percentage of GDP is rapidly accumulating. From 1946 through 2001, the average
deficit was a modest -1.5% of GDP. Then from 2002 through 2019, a generally prosperous era when GDP doubled, the average deficit soared to -4.1%. That’s more than 40% higher than the average deficit during the 1930s, when the Great Depression was raging.
Then the pandemic hit. Pandemic-era deficits have been almost without precedent. The only comparable period is WW2. From 1940 to 1945, the budget deficit averaged -14.7% of GDP; for 2020 and 2021, the budget deficit is
projected to average -14.2% of GDP. The total deficit for those two years will be roughly -28.4% of GDP; the total deficit for the ten years encompassing the Great Depression was -28.7%.
After the pandemic recedes, the CBO projects the next ten years will nevertheless average budget deficits of -4.2% of GDP. That’s without any of the enormous new spending bills currently being contemplated by Congress.
Recent deficits are not only dramatically different in magnitude than past deficits, they are also different in kind. Deficits today are largely financing a dramatic expansion in the welfare state through transfer payments to individuals.
Transfer payments -- handouts for which no services are performed -- are extremely inflationary. Whether financed through deficit spending or taxation, they are a direct redistribution of spending power to those with the highest propensity to consume rather than to save and invest. Moreover, these payments correspond with little or no increase in the productive capacity of the economy.
The above is merely a statement of fact, and not an indictment of any specific policy. The pandemic presented some novel risks that required novel policymaking. A robust and carefully architected social safety net is a moral imperative for an advanced society.
However, our prevailing formula is the perfect recipe for an increase in the price level: an enormous increase in demand for consumer goods with no corresponding increase in the current or future capacity of the economy to produce them. (If anything, there was a corresponding reduction in the productive capacity of the economy -- not only are transfer payments not paying people to work, in many cases, over-generous payments have been paying people
not to work.)
And while the pandemic has exponentially exacerbated the size and scope of transfer payments, perpetual increases in transfer payments is a trend that has been building for the better part of a century. Since the 1950s, every decade has seen an expansion in the average size of transfer payments whether measured as a
percentage of GDP or as a
percentage of federal receipts. As a percent of GDP, transfer payments steadily grew from 3% in the 1950s to 11% in the 2010s. As a percent of federal receipts, transfer payments steadily grew from 17% in the 1950s to 61% in the 2010s.
During the pandemic, transfer payments have averaged 18% of GDP and, shockingly, 102% of federal receipts. Yes, the federal government has distributed more in handouts than it has received in income. The federal government is running a deficit before attending to any of its multifarious responsibilities -- before any spending on things like education, science, environmental protection, infrastructure, the military, or paying its two million civilian employees.
The reckoning.
While we believe the above points to an impending battle with sustained inflation, those in the transitory camp would point out that our primary nemesis over recent decades has actually been deflation, despite deficits and loose monetary policy. Once the pandemic recedes, government stimulus will fall, and we’ll be back to worrying about deflation.
This is reasonable on its face. There are inflationary and deflationary forces at work at all times in the economy. Deficit spending and easy monetary policy are both inflationary, but aren’t necessarily inflationary enough to overcome deflationary forces at any given time.
At what level will inflationary forces prevail? When deficits are 4% of GDP? Maybe not. But what about 20%? When annual QE is $300 billion? Maybe not. But what about $1.5 trillion?
From both first principles and recent inflation data, it seems to us like the latter figures are large enough. But honestly, there is no way to know for sure.
However, it is evident that the federal government will continue to push the envelope until we reach the tipping point. Monetary and fiscal stimulus have been virtually monotonically increasing on a multi-decade timescale. Even before the pandemic we were on an unsustainable trajectory; the pandemic didn’t create these issues, it merely hastened the climax and the eventual reckoning. Since bottoming around 22% of GDP in 1974, federal debt held by the public has ballooned to nearly
100% of GDP. Gross federal debt (i.e., including debt the government
owes itself, interest payments on which the Social Security Trust Fund relies to fund its operations) is at
126% of GDP, higher than at the end of WWII. And absent draconian cuts -- rather than the massive new spending bills currently impending -- the public debt is projected to climb ever higher, year after year.
Once the people and their representatives discover they can vote themselves money today with no immediate ill consequences, it proves impossible to resist.
Bread and circuses have been debasing currencies from time immemorial. Despite 5.5 million lost jobs, pandemic-era programs cut the poverty rate
nearly in half. Do we expect -- and should we expect -- 20 million people to slip quietly back into poverty?
It is naive to think that pandemic-era programs will totally recede with the pandemic itself. As Milton Friedman once
quipped, “Nothing is so permanent as a temporary government program.” We have established a new, higher floor for government stimulus, and that floor will only grow until a crisis precipitates a reckoning.
The alternative.
Fiscal policy has fostered the everything bubble via deficit spending. When the government runs a deficit, the other sectors of the economy must, as an accounting identity, run a
surplus. Thus have
corporate earnings and
personal savings been driven to new highs even as the economy has languished. Artificially high corporate profits have made trailing earnings growth spectacular and balance sheets stronger, boosting the prices of both stocks and bonds.
But the main cause of the everything bubble is excessively easy monetary policies. Following a decade of interest rate repression, the real yield on
5-year TIPS has averaged -0.3% since 2011, and for much of 2021 has been hovering near all-time lows around -1.7%. Negative real yields on safe and short-term investments like government bonds and savings accounts have encouraged yield-starved investors to search for returns elsewhere, pushing up all asset prices. While this has created paper wealth by pulling forward returns on financial assets, it has also sowed the seeds for a future of dismal long-term returns.
The prospects for fixed income returns from bonds are self-evidently dreadful. Investing in medium-term Treasuries promises you a -1.7% real return over the next 5 years. If you want to avoid that fate by going long term, you can lock in your money for
30 years and enjoy a -0.4% real return annually. If you want to avoid that fate by taking credit risk, you can buy the lowest-quality investment-grade
corporate bonds for a 1.1% pick-up in yields (9th percentile) and enjoy only modestly negative real returns.
This has given birth to the
“TINA” narrative: there is no alternative to stocks.
There is no mechanistic link between interest rates on government debt and stock valuations. The equity risk premium and estimates of future earnings can and do change independent of interest rates. Nonetheless, a presumed negative correlation between rates and stock valuations is part of the zeitgeist.
Higher rates would demolish the bullish narrative that purports to explain why historically unconscionable valuations are in fact justified and reasonable. Valuations may be justified, in that returns to equities are likely to be comparable to returns on fixed income. But valuations are not reasonable, in that returns to equities are likely to be negative in real terms. That’s the consequence of pricing equities in comparison to deeply negative real interest rates.
We believe inflation is likely to be the catalyst that ultimately pops the everything bubble. If we are correct, eventually the Fed will have to reverse course, tightening policy and raising interest rates. When this happens, investors who have speculated in low or no-yielding assets like SPACs, high-flying growth stocks, and NFTs may find their portfolios permanently impaired.
However, our concerns around valuation are not predicated on the return of persistent inflation. Equities are always vulnerable to panics, and today’s extreme valuations means stocks are highly exposed to small changes in discount rates. With S&P 500 dividend yields starting at a historically average level of 3%, a 1% increase would cause a -25% drop in stock prices -- a large fall surely, but a run-of-the-mill bear market. With dividend yields starting at today’s
level of 1.3%, a mere 1% increase would cause a -43% drop in stocks. A return to historically average dividend yields would cause a -57% drop. It’s worth contemplating the returns necessary to recoup your money after a -43% drop (+75%) and a -57% drop (+133%).
Negative real returns could be realized via an excruciating but swift correction that returns yields to more reasonable levels, or negative real returns could be realized via a long and boring stagnation in asset prices. Either way entails the death of easy real returns from passive investing.
But the death of passive does not mean your returns need to be correspondingly dismal. At Bireme, clients are positioned to succeed in several ways.
As a value manager, our long positions are concentrated in value stocks and our short positions in growth stocks. Value stocks have low duration relative to growth stocks, and thus value managers can benefit in rising rate environments that disproportionately impair long duration assets. We talked before about the dismal -17% total real return for equity investors during the eight year period of high and rising inflation from March of 1973 until June of 1981. That return wasn’t evenly split by value and growth investors, however; in fact, this was one of the best periods of all time for the relative performance of value. The most expensive quintile of stocks saw a -36% real total return, while the cheapest quintile saw a +75% real total return -- an annual outperformance of more than 12%.
7
In Fundamental Value, our active and concentrated strategy allows us the opportunity to find diamonds in the rough rather than passively accept the dismal return prospects of the market as a whole. Today we are about 70% net long, less exposed to market fluctuations than passive investors.
Our long book is focused on value stocks that should outperform in an environment of rising rates. These firms generally trade at much cheaper valuation multiples than the overall market, and produce near-term cash flows whose value to today’s investor will not be dramatically impacted by a rise in discount rates. We tend to own companies with pricing power, insulating their real earnings from sustained inflation. These are companies with loyal customers, strong market positions, and a track record of passing through cost increases. We also own financials whose earnings will benefit from net interest margin expansion if rates go up. And our short book is focused on the growth stocks whose high valuations are most dependent on repressed interest rates. Even though valuations for both growth and value stocks are historically high, the valuations for growth stocks are so obscene that the value spread remains elevated, leaving substantial alpha opportunities for a long/short manager such as ourselves.
Our mandate allows for some international exposure as well, and we are increasingly finding opportunity there where valuations aren’t nearly as obscene. The forward PE of the MSCI US Index is 22.3, while the forward PE of the rest of the world is 14.7. That 50% discount is essentially a record high.
8
We anticipate the major asset classes are on the precipice of enduring a long period of disappointing returns. However, opportunities abound for discerning long-short value managers to outperform.
There
is an alternative.
- Bireme Capital
Follow our content by subscribing here.
1 Net calculations assume a 1.75% management fee. Fee structures and returns vary between clients. FV inception was 6/6/2016.
2 This isn’t just a function of falling earnings due to covid; if we substitute pre-covid results into our calculation, the median valuation of value stocks (the bottom third of the market) looks just about as expensive. This is because only a small minority of publicly traded companies in our sample are still significantly impaired due to covid. Most companies are more profitable than ever. For more information on our methodology, see here. All data here and in the calculations throughout the letter is the latest data available as of 9/17/2021 unless otherwise specified.
3 We promised to have more to say about SPACs in our last letter. However, at this point it is clear that SPACs have been relegated to a role of only minor importance, since peak-SPAC is behind us and the everything bubble has emerged as our concern du jour. We continue to believe that SPACs in their current form virtually guarantee poor returns to common shareholders. This is clear from first principles, and evidenced by returns -- over the 12 months post merger, the median SPAC has returned -65%. For more, please see this Q&A we did with the financial analysis website SumZero.
4 Data from Bloomberg, FRED and Robert Shiller.
5 Ironic for an institution that, by boosting the prices of capital assets that are overwhelmingly concentrated in the hands of the wealthy, has arguably done more to exacerbate inequality than any other single actor.
6 UM and CB data from Bloomberg.
7 Book-to-market quintiles from Ken French’s data library.
8 MSCI US Index forward 12m PE vs MSCI ACWI Ex US Index forward 12m PE. Data from Bloomberg.