
Page 138 - TransportationPlanUsetsGuide
P. 138
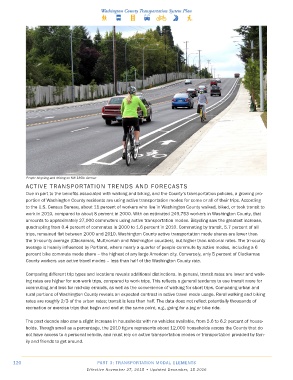
People bicycling and driving on NW 185th Avenue
            ACTIVE TRANSPORTATION TRENDS AND FORECASTS
            Due in part to the benefits associated with walking and biking, and the County’s transportation policies, a growing pro-
            portion of Washington County residents are using active transportation modes for some or all of their trips. According
            to the U.S. Census Bureau, about 11 percent of workers who live in Washington County walked, biked, or took transit to
            work in 2010, compared to about 8 percent in 2000. With an estimated 249,753 workers in Washington County, that
            amounts to approximately 27,000 commuters using active transportation modes. Bicycling saw the greatest increase,
            quadrupling from 0.4 percent of commutes in 2000 to 1.6 percent in 2010. Commuting by transit, 5.7 percent of all
            trips, remained flat between 2000 and 2010. Washington County active transportation mode shares are lower than
            the tri-county average (Clackamas, Multnomah and Washington counties), but higher than national rates. The tri-county
            average is heavily influenced by Portland, where nearly a quarter of people commute by active modes, including a 6
            percent bike commute mode share – the highest of any large American city. Conversely, only 5 percent of Clackamas
            County workers use active travel modes – less than half of the Washington County rate.


            Comparing different trip types and locations reveals additional distinctions. In general, transit rates are lower and walk-
            ing rates are higher for non-work trips, compared to work trips. This reflects a general tendency to use transit more for
            commuting and less for mid-day errands, as well as the convenience of walking for short trips. Comparing urban and
            rural portions of Washington County reveals an expected contrast in active travel mode usage. Rural walking and biking
            rates are roughly 2/3 of the urban rates; transit is less than half. The data does not reflect potentially thousands of
            recreation or exercise trips that begin and end at the same point, e.g., going for a jog or bike ride.


            The past decade also saw a slight increase in households with no vehicles available, from 5.6 to 6.2 percent of house-
            holds. Though small as a percentage, the 2010 figure represents about 12,000 households across the County that do
            not have access to a personal vehicle, and must rely on active transportation modes or transportation provided by fam-
            ily and friends to get around.


      120                                 PART 3: TRANSPORTATION MODAL ELEMENTS
                                     Effective November 27, 2015 • Updated December, 15 2016