Page 22 - Rural Tourism Report Washington County
P. 22

CHAPTER 2: THE WASHINGTON COUNTY AGRICULTURE SECTOR


            Historical Profile of Farms by Value of Gross Sales                    Outlook
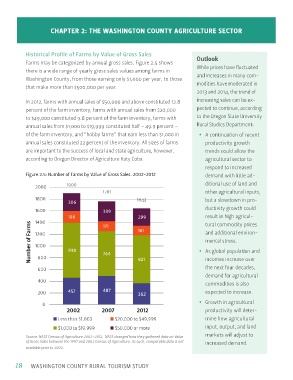
            Farms may be categorized by annual gross sales. Figure 2.5 shows

            there is a wide range of yearly gross sales values among farms in      While prices have fluctuated
            Washington County, from those earning only $1,000 per year, to those   and increases in many com-
            that make more than $500,000 per year.                                 modities have moderated in
                                                                                   2013 and 2014, the trend of

            In 2012, farms with annual sales of $50,000 and above constituted 12.8   increasing sales can be ex-
            percent of the farm inventory, farms with annual sales from $20,000    pected to continue, according
            to $49,000 constituted 9.8 percent of the farm inventory, farms with   to the Oregon State University
            annual sales from $1,000 to $19,999 constituted half – 49.9 percent –   Rural Studies Department:
            of the farm inventory, and “hobby farms” that earn less than $1,000 in     • A continuation of recent
            annual sales constituted 22 percent of the inventory. All sizes of farms   productivity growth
            are important to the success of local and state agriculture, however,      trends could allow the
            according to Oregon Director of Agriculture Katy Coba.                     agricultural sector to

                                                                                       respond to increased
            Figure 2.5: Number of Farms by Value of Gross Sales. 2002-2012             demand with little ad-
                             1900                                                      ditional use of land and
                                            1761                                       other agricultural inputs,
                                                          1643                         but a slowdown in pro-
                                                                                       ductivity growth could
                                                                                       result in high agricul-

                                                                                       tural commodity prices
                                                                                       and additional environ-
                                                                                       mental stress.
                                                                                       • As global population and

                                                                                       incomes increase over
                                                                                       the next four decades,
                                                                                       demand for agricultural
                                                                                       commodities is also
                                                                                       expected to increase.

                                                                                       • Growth in agricultural
                                                                                       productivity will deter-
                                                                                       mine how agricultural
                                                                                       input, output, and land

            Source: NASS Census of Agriculture 2002–2012.  NASS changed how they gathered data on Value   markets will adjust to
            of Gross Sales between the 1997 and 2002 Census of Agriculture. As such, comparable data is not   increased demand.
            available prior to 2002.


       18     WASHINGTON COUNTY RURAL TOURISM STUDY
   17   18   19   20   21   22   23   24   25   26   27