
Page 20 - Rural Tourism Report Washington County
P. 20
CHAPTER 2: THE WASHINGTON COUNTY AGRICULTURE SECTOR
Table 2.4 shows the market value of the top
commodities and how they rank within the 36
Oregon counties and all 3,079 counties in the United
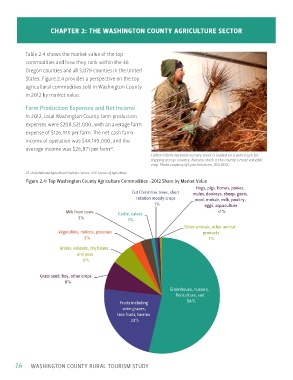
States. Figure 2.4 provides a perspective on the top
agricultural commodities sold in Washington County
in 2012 by market value.
Farm Production Expenses and Net Income
In 2012, total Washington County farm production
expenses were $208,521,000, with an average farm
expense of $126,915 per farm. The net cash farm
income of operation was $44,149,000, and the
average income was $26,871 per farm .
21
Carlton Plants bareroot nursery stock is loaded on a semi truck for
shipping across country. Nursery stock is the county’s most valuable
crop. Photo courtesy of Lynn Ketchum, OSU EESC
21 USDA National Agricultural Statistics Service 2012 Census of Agriculture
Figure 2.4: Top Washington County Agriculture Commodities -2012 Share by Market Value
16 WASHINGTON COUNTY RURAL TOURISM STUDY