Target Curves and Views
Table of Contents
Overview
Tonal Balance Control displays spectrum metering information relative to a target curve for the track it is currently inserted on. This is particularly useful when dealing with tonal balance issues that arise during mixing and mastering. Tonal Balance Control can help provide context and direction toward resolving issues with a mix or master that is lacking the low-end power or high-end brilliance found in professionally produced, radio-ready material.
Target Curves
Tonal Balance Control includes a number of factory target curves that represent typical spectral shapes found in different styles of music. You can also generate and save your own custom target curves based on a single track or collection of tracks. You can view and load available target curves using the target curve menu in the plug-in header.

Custom Target Curves
You can create custom target curves and manage your target curve folder using the menu to the right of the target curve selection menu.
- Create target from audio file…: Allows you to select an audio file to create a custom target curve.
Supported audio file formats
You can create custom target curves using the following audio file formats: AIFF, WAV, MP3, M4A, FLAC, OGG.
- Create target from folder…: Allows you to choose a folder of audio files to generate a target curve from. A single target curve will be created based on all of the audio files in the selected folder.
- Save custom target as…: Saves the current custom target curve to your target curve preset folder. After you have generated a custom target curve, you need to save it using this menu item in order for it to appear in the target curve menu in future sessions.
- Change target folder…: Opens a system dialog that allows you to select a different location to store
and recall target curves.
Default Target Curve locations
Mac: ~/Documents/iZotope/Tonal Balance Control 2/Target Curves/
Windows: C:\Users\username\Documents\iZotope\Tonal Balance Control 2\Target Curves\ - Show target folder in finder/explorer…: Select to open a Finder (Mac) or Explorer (Windows) window to the current target curve directory.
Target Meter
Displays your track (in white) against the typical range of spectral variation for the selected target curve (in blue). You can switch between two different Target Meter views: Broad View and Fine View. The frequency spectrum is divided into four main frequency ranges:
- Low: 20 Hz to 250 Hz
- Low-mid: 250 Hz to 2 kHz
- High-mid: 2 kHz to 8 kHz
- High: 8 kHz to 20 kHz
Broad View
Displays target ranges for the selected target curve within four discrete frequency ranges.

The input audio is divided into the same four frequency ranges and displayed as white horizontal lines within each range.
Fine View
Displays the target range across the frequency spectrum.

The input audio is displayed as a white curve across the frequency spectrum in this view.
Crest Factor
Displays a measurement of average loudness (the ratio of peak level and RMS (average) level) for the low end frequency range of your track.
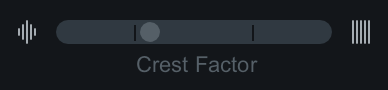
When the indicator is weighted to the left, the low end of your mix may be too dynamic. When the indicator is weighted to the right, the low end of your track may be too compressed.
More info
Learn more about Crest Factor on the iZotope website: What is Crest Factor?
Band Solo
Hovering over a frequency band label will show a Solo button.

Click and hold the solo button to temporarily isolate playback of the associated frequency range.
Band Indicators
The frequency band names along the top of the target meter view will change white to indicate when your track is within the target range for that frequency band.
