Spectrum Analyzer
Overview
A spectrum analyzer uses a fast Fourier transform (FFT) to extract frequency information from a waveform. Depending on the size of the FFT, the signal energy of thousands of frequency bands can be visually represented on a graph.
The RX Spectrum Analyzer will show the momentary spectrum of audio around the current playhead position, the average spectrum of a selected time and frequency range, or the real-time spectrum of the audio at the output of RX’s playback.
Controls
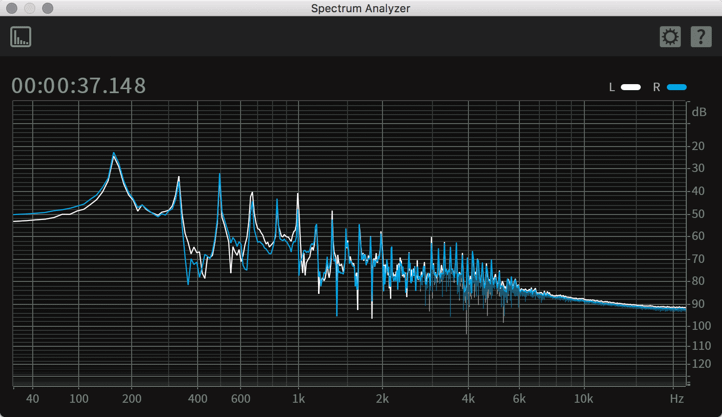
CHANNEL VIEW SELECTION BUTTONS
When viewing the spectrum analyzer of a stereo file, you can toggle the Left or Right channel spectrum display on or off by clicking on the L or R buttons in the upper right hand corner of the spectrum.
PEAK FINDING
The RX Spectrum Analyzer has a peak-finding feature that automatically detects peaks in the spectrum data. If you hover your mouse cursor near a peak in the spectrum, a readout will appear displaying the exact frequency of the peak, its amplitude, and the closest musical note. This peak-finding readout can provide much higher accuracy than simply inspecting the graph by zooming in on the display and/or increasing the FFT size in the settings window.
The circle displays the exact amplitude and frequency of the spectral peak. It is usually slightly above the spectrum, because each spectral peak consists of several FFT bins, and their power is added together. This effect is known as spectral smearing (or frequency smearing) and is controlled by the choice of a weighting window.