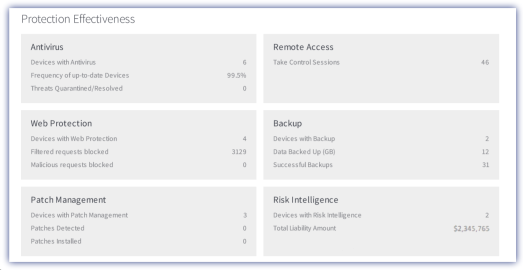
Protection Effectiveness
Protection Effectiveness provides details on the performance of a number of indicators during the selected month.
Section |
Notes |
|---|---|
|
Antivirus |
|
|
Devices with Antivirus |
Total number of devices running an Antivirus Update Check (all products) |
|
Frequency of up-to-date Devices |
Total number of times the Antivirus Update Checks were reported as up-to-date across all Servers and Workstations where the Check was configured. (all products) |
|
Threats Quarantined / Resolved |
Total number of threats quarantined and resolved. This information is only available for Managed Antivirus |
|
Backup |
|
|
Devices with Backup |
Total number of devices with the Backup Check (all products) |
|
Data Backed Up (GB) |
Volume of data backed up. This information is only available for Backup & Recovery |
|
Successful Backups |
Total number of successful Backup Checks (all products) |
|
Help Desk |
|
|
Client-Raised Tickets Closed |
Total number of tickets raised by the client and marked as closed. This information is only available for MAX Service Desk |
|
Monitoring Tickets Closed |
Total number of monitoring tickets raised and closed. This information is only available for MAX Service Desk |
|
Hours Spent on Tickets |
Total amount of time allocated against tickets. This information is only available for MAX Service Desk |
|
Patch Management |
|
|
Devices with Patch Management |
Total number of devices running Patch Management |
|
Patches Detected |
Total number of missing Patches detected (in Executive Summary Reports generated for February 2017 onwards, this total does not include Patches that were set to Ignored) |
|
Patches Installed |
Total number of Patches installed |
|
The Executive Summary Report contains the total number of patches detected and installed during the specified month. |
|
|
Remote Access |
|
|
Take Control Sessions |
Total number of Take Control Session |
|
Remote Background Sessions |
Total number of Remote Background Sessions |
|
Remote Desktop Protocol Sessions |
Total number of Remote Desktop Protocol Sessions |
| Risk Intelligence | |
|
Devices with Risk Intelligence |
Total number of devices running Risk Intelligence Scans |
|
Total Liability Amount |
Total liability amount of all Risk Intelligence devices under management |
|
Web Protection |
|
|
Device with Web Protection |
Total number of devices running the Web Protection |
|
Filtered Requests Blocked |
Total number of web requests that were blocked based on the selected filtering categories |
|
Malicious Requests Blocked |
Total number of web requests that were blocked based as malicious |
What do you want to do?