Managing Devices and Checks
After installing the Monitoring Agent on a computer it appears in our web-based portal, the Dashboard.
From here, view both the Check and Device's current state and Outage history, Manage Checks andconfigure alerting. After investigating a Check failure mark it as acknowledged (cleared) so it no longer appears as a problem on the Dashboard and Wall Chart.
Add Client and/or Technical Dashboard Notes with information relevant to your customer or team. View the device's asset information in the Asset Tracking section (available from the View menu).
Setup Automated Tasks (scripts) on Windows and Mac computers to run manually, Daily, Weekly, Monthly or when a Check fails
For Windows, enable and configure features including Take Control, Managed Antivirus, Backup & Recovery, Patch Management and Web Protection
Please ensure the login you have accessed the Dashboard under has the required Permissions enabled to ensure you can carry out the required actions.
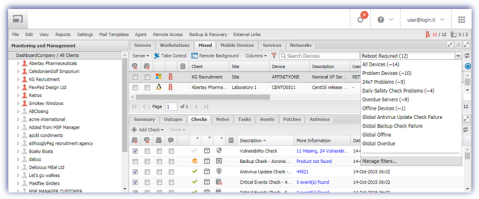
Dashboard Layout
North Pane
The computer appears the Servers or Workstations as well as the Mixed (both Servers and Workstations) sections.
The north pane section the Device appears in depends on the Operating System and, for Windows workstations, the mode the Agent was manually installed under (Server or Workstation).
| Operating System | Section | |||
|---|---|---|---|---|
| Server | Workstation | Mixed | ||
| Windows | Server OS | Yes | Yes | |
| Workstation OS | Yes * | Yes | Yes | |
| Linux | Yes | Yes | ||
| Mac | Yes | Yes | ||
| * where Server mode is selected during the manual Agent installation process | ||||
In addition to computer monitoring, the Dashboard also contains sections for Mobile Device Management (Mobile Devices), App Control (Services), App Control (Networks - includes the ability to Push Install the Monitoring Agent to Windows and Mac computers), NetPath (View, NetPath).
The Monitoring and Management Dashboard contains the Client and Site selection tree, expand a Client to view all of its Sites, select a Site to view its Devices.
The default Client sorting behavior for the selection tree is configurable from View, Sort Clients. Select the problem type (Server Problems and/or Workstation Problems) that highlight Clients in red and show them at the top of the tree.
The Device information returned in the north pane is managed through the top left filter drop-down. Choose from the default filters, or use the Filter Manager to create your own.
South Pane
The following south pane tabs are available depending on the Operating System and installed features.
|
Tab |
Feature |
Notes |
OS |
|---|---|---|---|
|
Summary |
Device hardware details, Agent Features, overall Check status, IP address of last upload (if known) |
Windows, Mac, Linux |
|
|
Outages |
Information on Check failures and when the device was overdue or offline. |
Windows, Mac, Linux |
|
|
Checks |
View Check Results and manage Checks |
Windows, Mac, Linux |
|
|
Notes |
View, Edit, Delete Notes |
Windows, Mac, Linux |
|
|
Tasks |
Manage Automated Tasks and view their results |
Windows, Mac |
|
|
Assets |
View the Device's Hardware and Software information |
Windows, Mac, Linux |
|
|
Patches |
Manage Patches and view the results of the Patch Scan |
Windows |
|
|
Antivirus |
View discovered Threats, Scan results and Quarantine. Set Threat Policy and Quarantine Action. |
Windows |
|
|
Backup |
View the history of the backup jobs. Initiate backup and restore sessions |
Windows |
|
|
Web |
View Day, Website and Category activity (options depend on account privacy settings) |
Windows |
From Windows Workstation Monitoring Agent 8.4 the Username column displays the currently logged on user.
Where the device was recently added, it may be necessary to refresh your Dashboard or browser to view its information.
To avoid the generation of invoices for Dashboard devices that are no longer in use, we would suggest using the Dashboard's device deletion options or manually uninstall the Agent to remove them.
Generate an Added and deleted Devices Report for information on Devices activity over a selected time-period.