Data Science for Librarians Final Project
Interactive Term Frequencies with D3.js
Key Lessons
- Synthesize multiple pre-existing sources of data to create something new.
- "Data wrangling" is not always pretty and you may have to spend the majority of your time trying to get your data to do what you want--that's okay.
- Visualization is the fun part! Here, I used d3.js , but we learned in class that you can also use R's visualization libraries, Tableau, and the user-friendly Google Charts.
How I made it
Term frequencies are calculated from the abstracts and titles of the 200 most cited astronomy articles each year from 1980 to 2013. This project used the Unified Astronomy Thesaurus to map the relationships between terms and synthesisize synonyms.
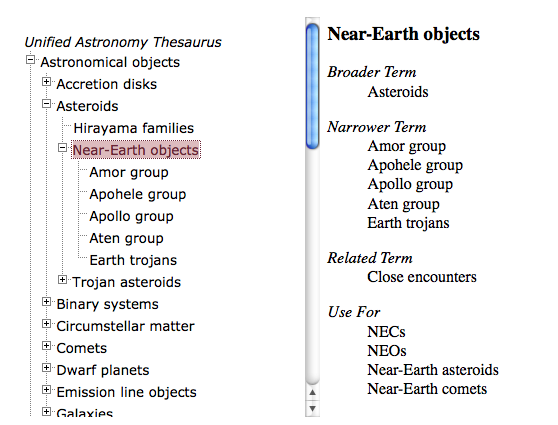
The Unified Astronomy Thesaurus provides information about the parent, child, and sibling relationships between astronomical terms, and also maintains a list of alternate terms under the heading "Use For", as you can see in the following screenshot:
Unified Astronomy Thesaurus
You can read the project's Python code here.
How to use it
Click on any word on the left to explore its sub-terms and their frequencies in the ADS. To reverse direction, click anywhere on the body of the chart. means you can continue to click through
means there are no more child terms