
Page 13 - Rural Tourism Report Washington County
P. 13
CHAPTER 2: THE WASHINGTON COUNTY AGRICULTURE SECTOR
Recent History of Washington County's Agriculture Sector
The Dynamics of Farm Numbers and Acreage captured by satellite technology within USDA NASS
In 2012, Washington County produced a wide CropScape maps, are shown in Figure 2.3 on page 12.
variety of crops and animals on 1,643 farms
using 135,733 acres of farmland or almost According to the OSU Extension Rural Studies
11
14
one-third of the County’s 464,640 total acres . program , the recent recession seems to have taken
12
While Washington County represents only a its toll on many of the smaller farms that did not
small percentage of Oregon’s 16.3 million acres have the reserves or assets to weather the downturn.
of farmland, much of Washington County’s Figure 2.1 shows a decrease in number of farms
agricultural acreage is considered high-value between 2002 and 2012, most notably fairly small
farmland , made up of productive soils typical in farms between 10 and 49 acres. Figure 2.2 shows an
13
the northern Willamette Valley. increase in overall farm acreage during that same
10 year period, the majority of expansion occurring
The location of crops, pasture land, and woodlots within the largest farms. The figures suggest that
is interspersed rather than concentrated in one the largest farms may have absorbed many of the
section of the County’s rural area. The locations of smaller ones, but also that additional land was newly
major Washington County commodity categories, converted to agricultural use.
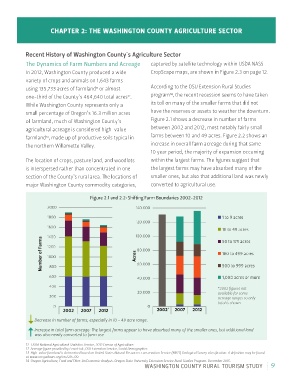
Figure 2.1 and 2.2: Shifting Farm Boundaries 2002-2012
*2002 figures not
available for some
acreage ranges so only
total is shown
Decrease in number of farms, especially in 10 - 49 acre range.
Increase in total farm acreage: The largest farms appear to have absorbed many of the smaller ones, but additional land
was also newly converted to farm use
11 USDA National Agricultural Statistics Service, 2012 Census of Agriculture.
12 Acreage figure provided by Lena Etuk, OSU Extension Service, Social Demographer.
13 High-value farmland is determined based on United States Natural Resources conservation Service (NRCS) Geological Survey classification. A definition may be found
at www.oregonlaws.org/ors/215.710.
14 Oregon Agriculture, Food and Fiber: An Economic Analysis. Oregon State University Extension Service Rural Studies Program. December 2015.
WASHINGTON COUNTY RURAL TOURISM STUDY 9