Updated: 8 December 2017
Study Document and Appendices
Primary Mapping Products from Study
Links to online maps are best viewed using Google Chrome, Safari or IE Edge
See Addendum 1 of study documentation for description of map information
Historic Vulnerability Locations and Risk Assessment { Updated September 2017 }
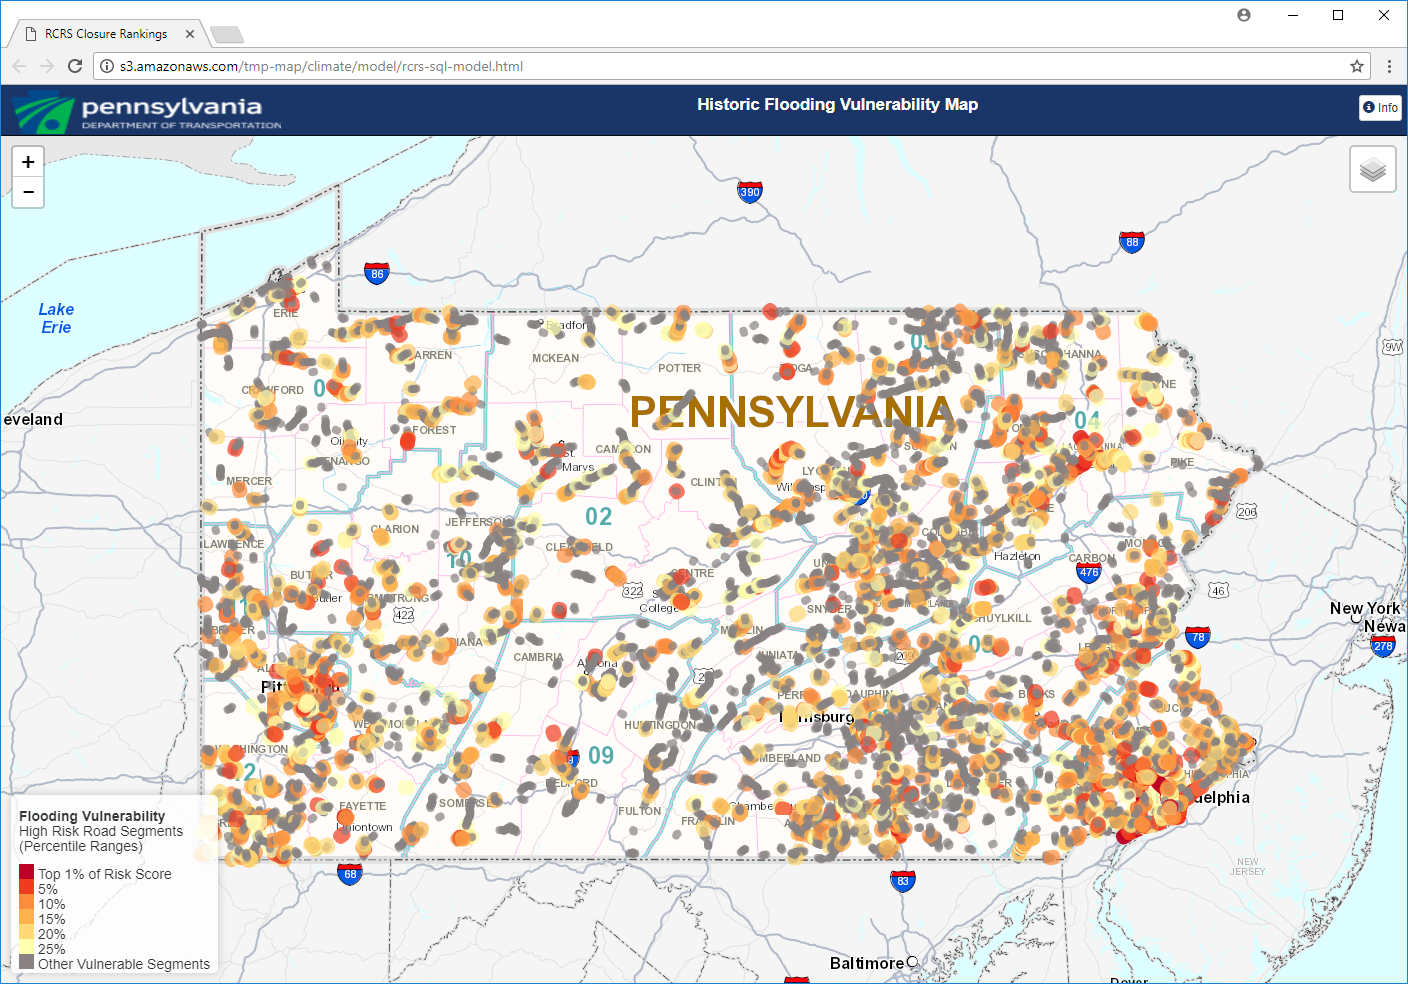
(1 MB) Zipped GIS .shp file { RCRS model-ranks.zip }
Historic Vulnerability Locations and Risk Assessment { Multi }
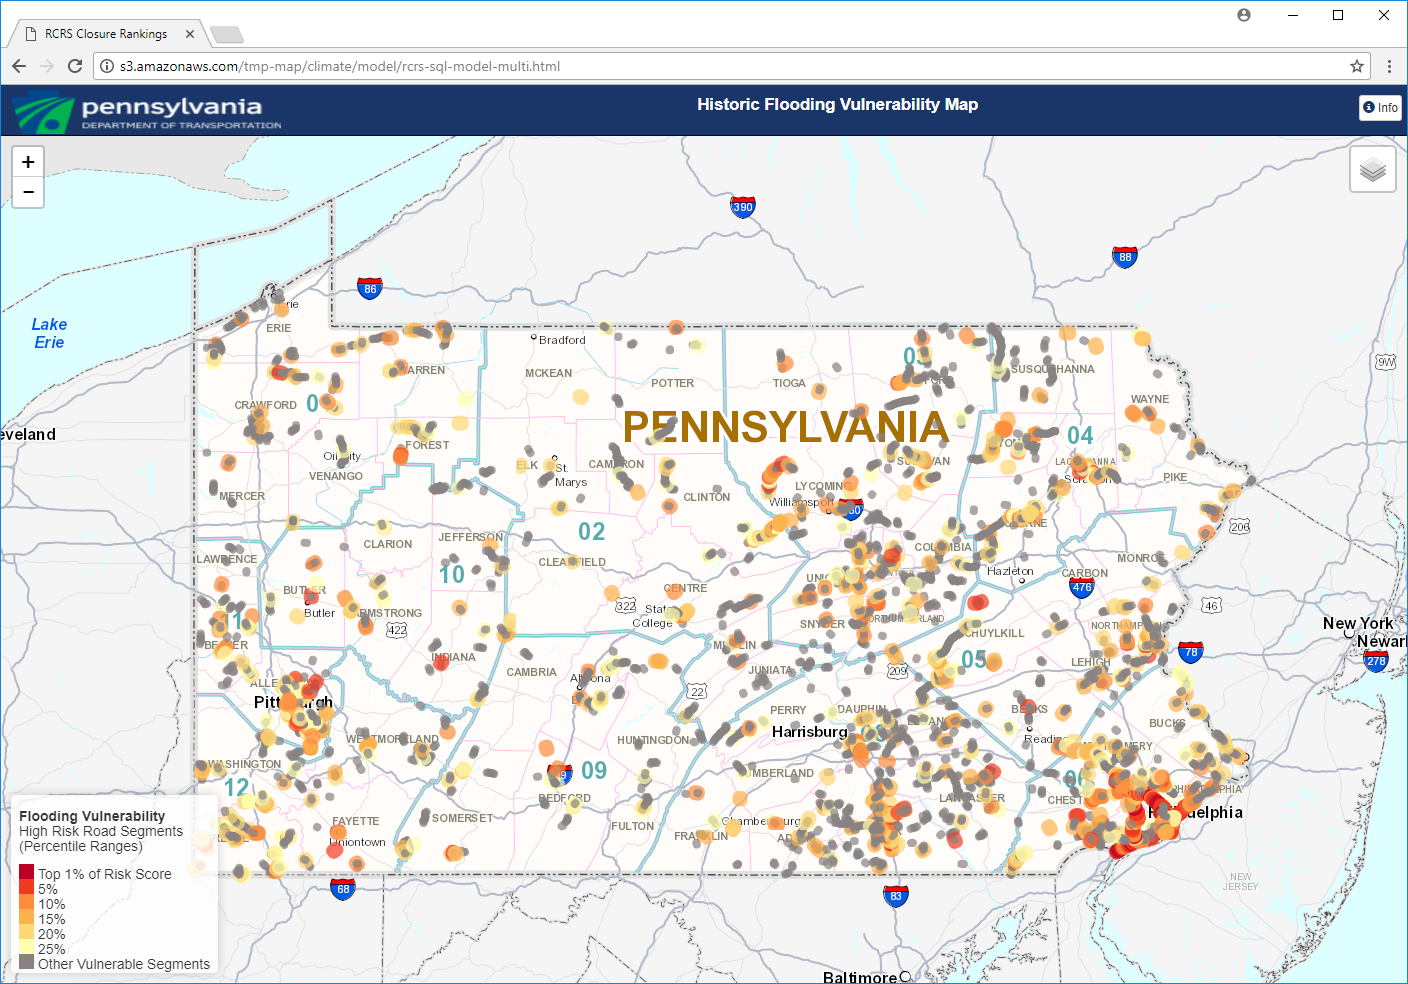
(1 MB) Zipped GIS .shp file { RCRS model-ranks.zip }
Future Vulnerability Locations and Risk Assessment
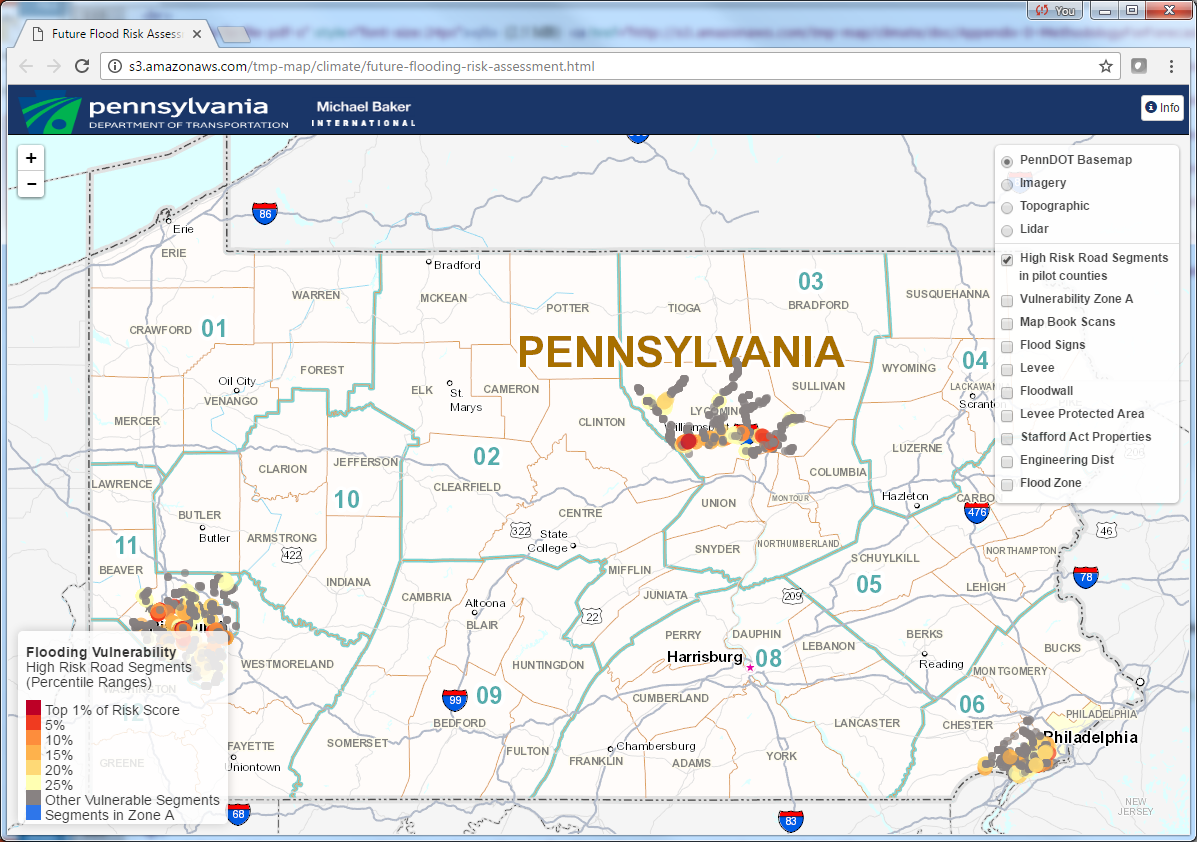
future-flooding-risk-assessment.html
(372 KB) Zipped GIS .shp file { future-high-risk-segments.zip }
(54 KB) Zipped GIS .shp file { zone-a-road-segments.zip }
Other Mapping Products from Study
Historic Flooding Vulnerability and DCNR Karst Features
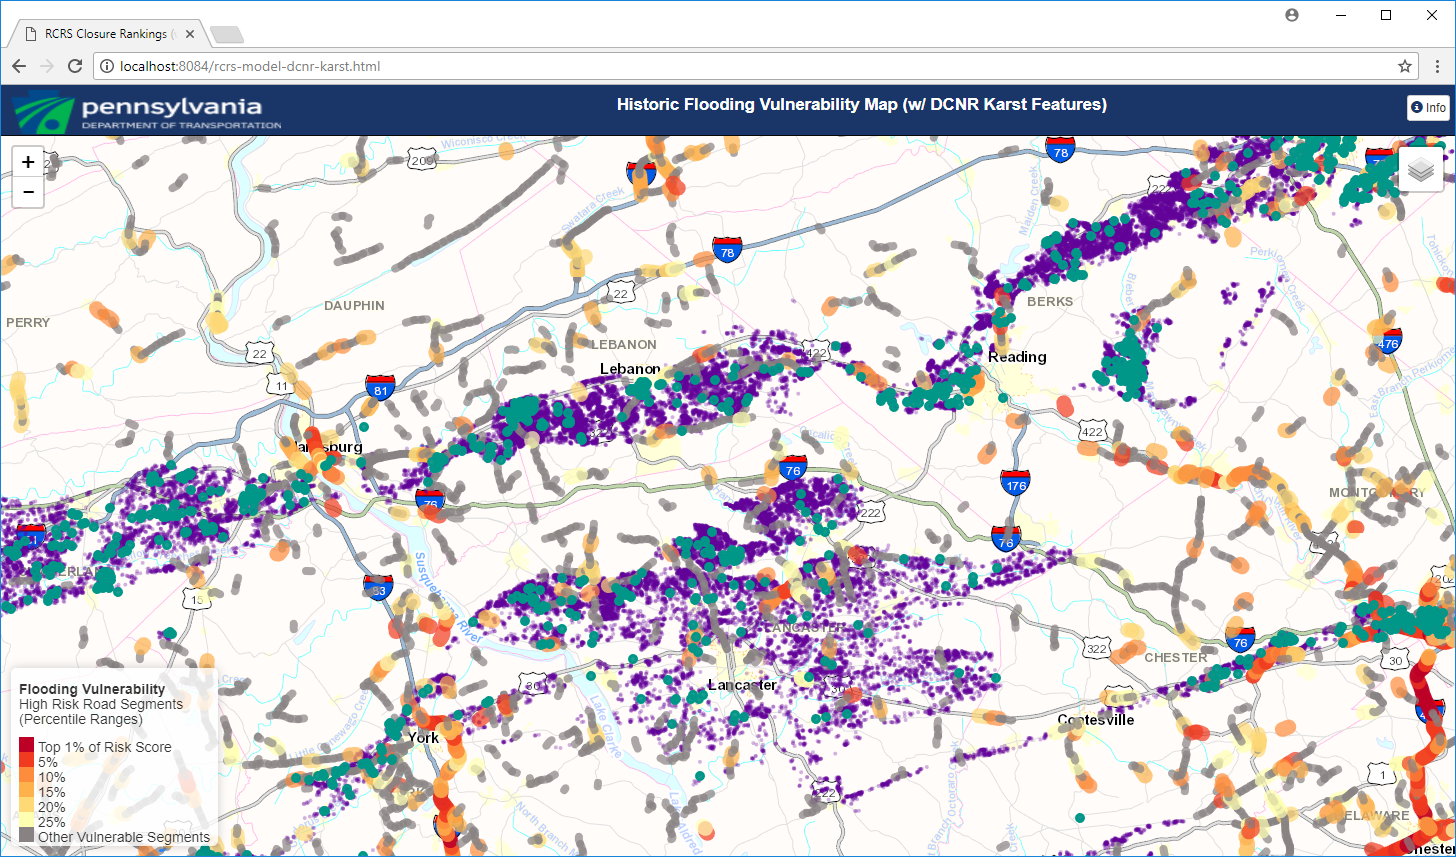
Historic Flooding Segments with additional overlays of Sinkholes and Depressions from the DCNR Karst Features Database.
WikiMapping Data by Category
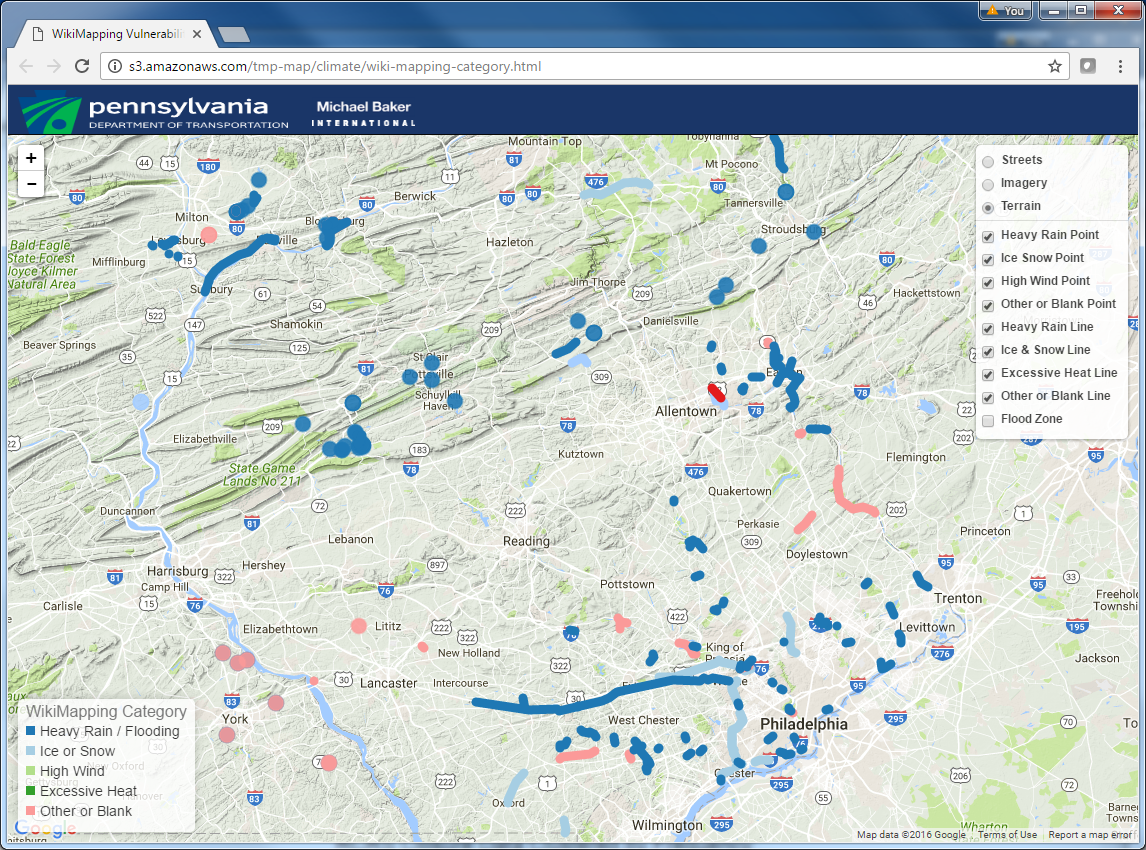
WikiMapping Data by categorized by event type.
RCRS Closure Data Clustered by Frequency
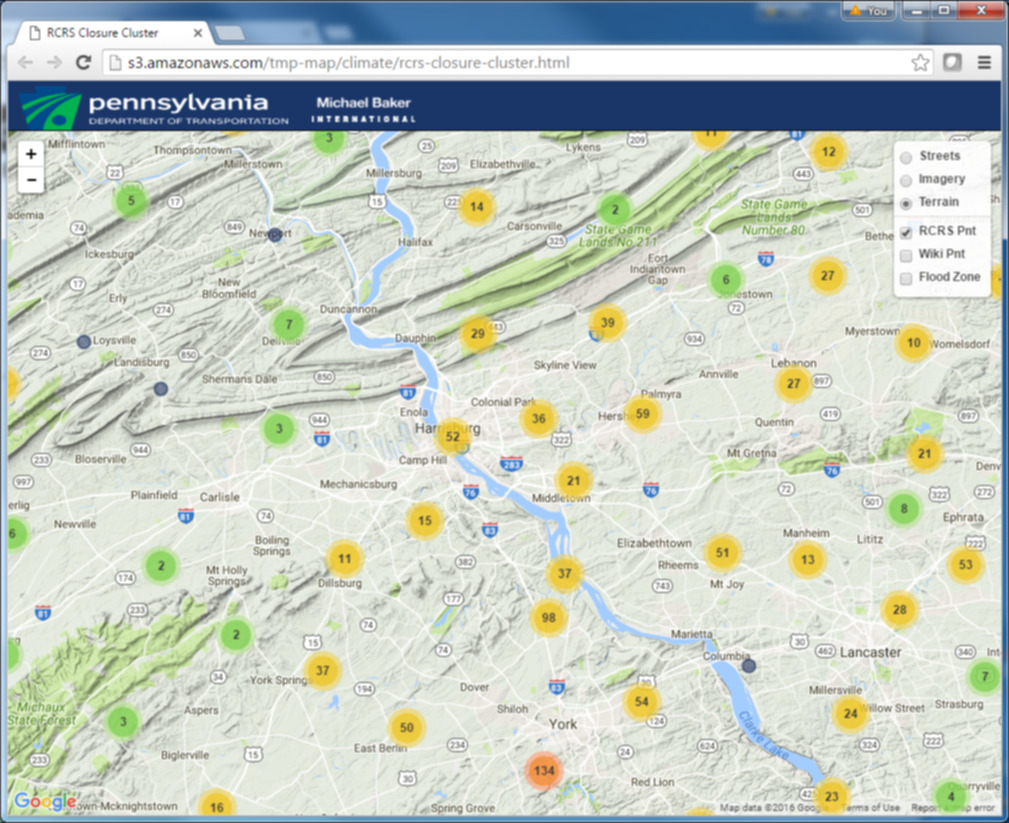
RCRS data clustered by taking the mid-point of the road segment and grouping the records by RCRS ID, Comment and Date.
Map Data Sources:
| # | Source Table | Data Link | Fields |
|---|---|---|---|
| 1 | PennDOT RCRS | Pennshare Link | RCRS ID, Description, Date and Streetview Ling |
| 2 | PASDA Floodplains | PASDA Link | No fields displayed |
Lycoming County Vulnerable Conditions
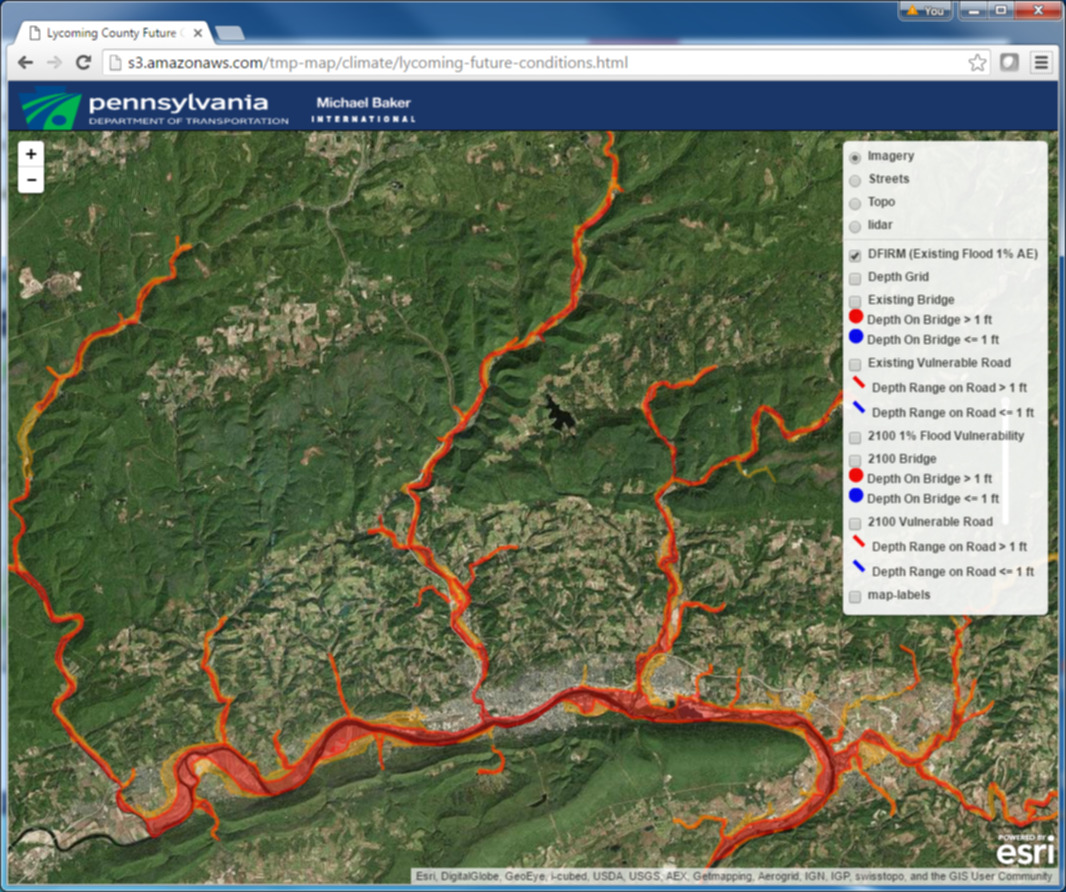
FEMA depth grids, Digitial Flood Insurance Rate Maps (DFIRM) and Base Flood Elevation data for Lycoming County.
Flooding vulnerability for the 1% annual chance flood was determined for existing conditions and for future conditions in the year 2100. Bridges were analyzed under existing and future conditions to determine flooding vulnerability, including the estimated water depth on the bridge. Roadways were also analyzed under existing and future conditions to determine flooding vulnerability, including the estimated water depth along the roadway.
(5.3 MB) lycoming-county-nov28.pdf
Map Data Sources:
| # | Source Table | Data Link | Fields |
|---|---|---|---|
| 1 | PennDOT BMS | BMS Data Dictionary | Bridge ID, Feature Intersect, Facility, Location, Length, Width, Traffic Volume, Scour Critical |
| 2 | FEMA DFIRM | PASDA Link | Zone, Source Citation, Floodway |
| 3 | FEMA Depth Grid | PASDA Link | No fields displayed |
| 4 | PASDA lidar hillshade data | PASDA Link | No fields displayed, Basemap |
Delaware County Vulnerable Conditions
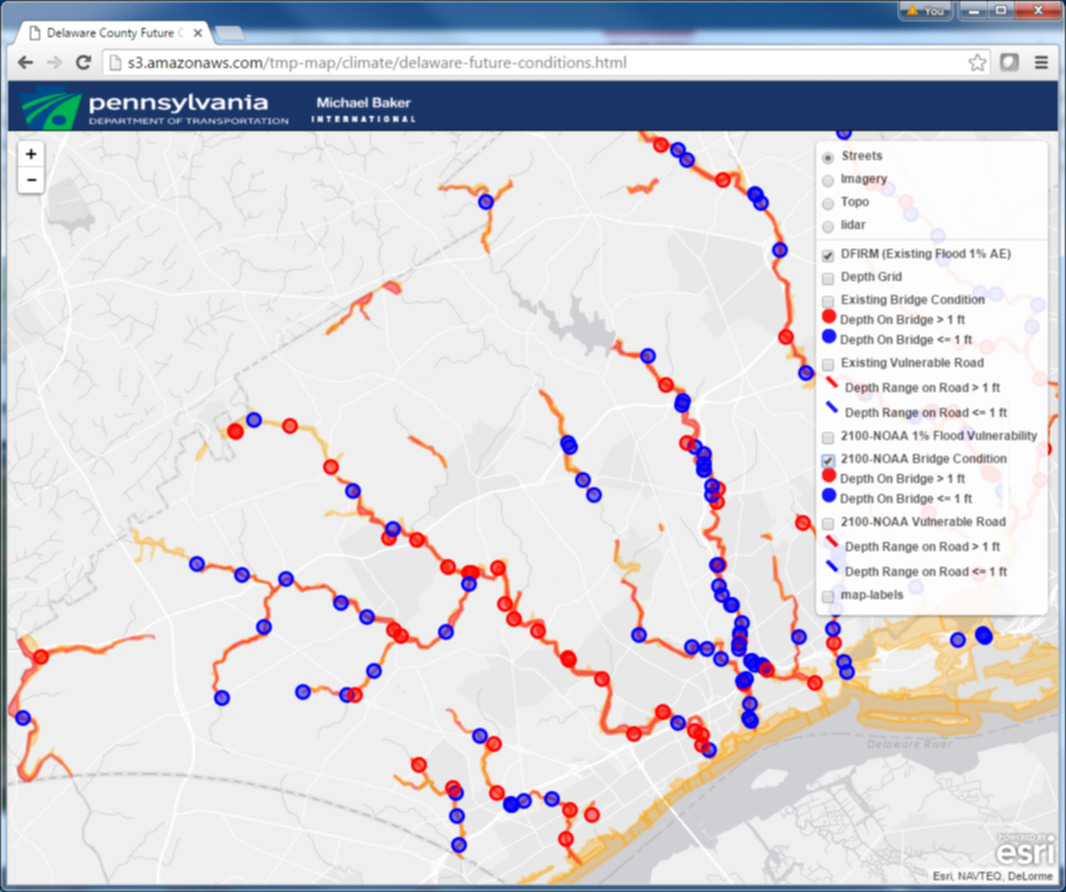
FEMA depth grids, Digitial Flood Insurance Rate Maps (DFIRM) and Base Flood Elevation data for Delaware County.
Flooding vulnerability for the 1% annual chance flood was determined for existing conditions and for future conditions in the year 2100. Bridges were analyzed under existing and future conditions to determine flooding vulnerability, including the estimated water depth on the bridge. Roadways were also analyzed under existing and future conditions to determine flooding vulnerability, including the estimated water depth along the roadway.
(6.6 MB) delaware-county-nov28.pdf
Map Data Sources:
| # | Source Table | Data Link | Fields |
|---|---|---|---|
| 1 | PennDOT BMS | BMS Data Dictionary | Bridge ID, Feature Intersect, Facility, Location, Length, Width, Traffic Volume, Scour Critical |
| 2 | FEMA DFIRM | PASDA Link | Zone, Source Citation, Floodway |
| 3 | FEMA Depth Grid | PASDA Link | No fields displayed |
| 4 | PASDA lidar hillshade data | PASDA Link | No fields displayed, Basemap |
Allegheny County Vulnerable Conditions
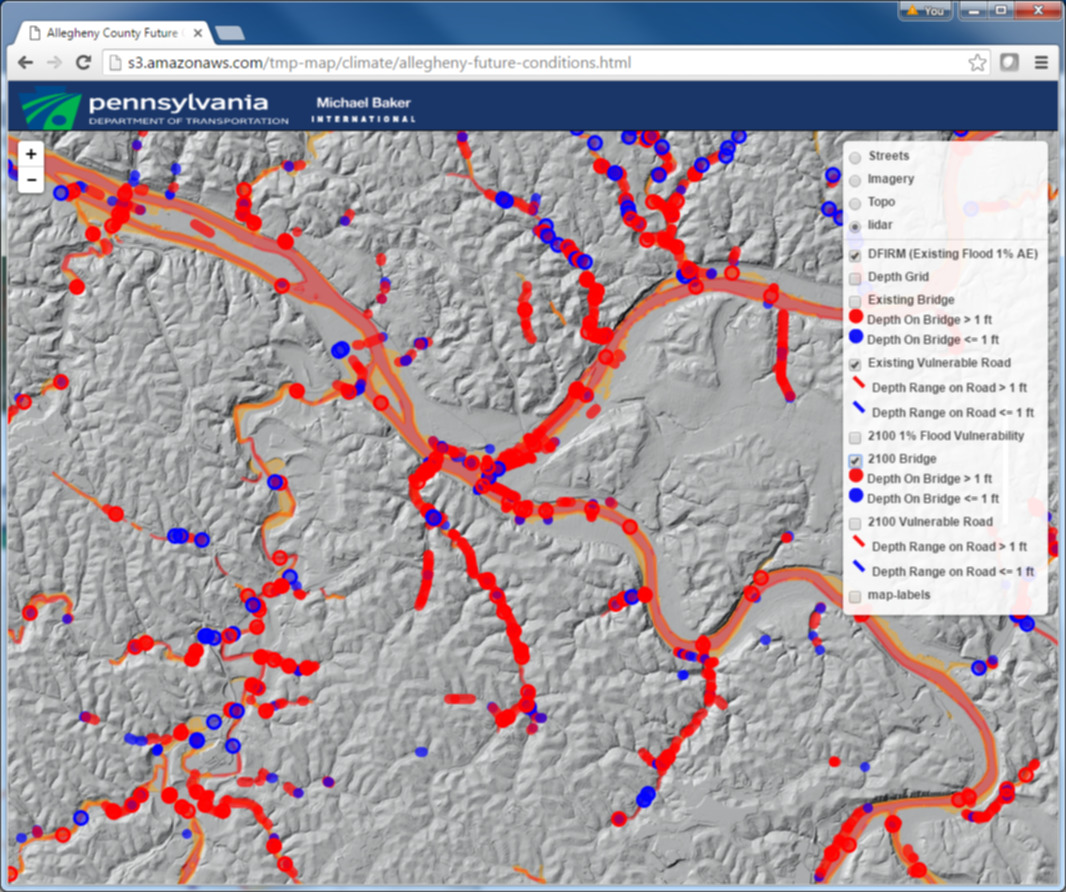
allegheny-2100-conditions.html
FEMA depth grids, Digitial Flood Insurance Rate Maps (DFIRM) and Base Flood Elevation data for Allegheny County.
Flooding vulnerability for the 1% annual chance flood was determined for existing conditions and for future conditions in the year 2100. Bridges were analyzed under existing and future conditions to determine flooding vulnerability, including the estimated water depth on the bridge. Roadways were also analyzed under existing and future conditions to determine flooding vulnerability, including the estimated water depth along the roadway.
(7.2 MB) allegheny-county-nov28.pdf
Map Data Sources:
| # | Source Table | Data Link | Fields |
|---|---|---|---|
| 1 | PennDOT BMS | BMS Data Dictionary | Bridge ID, Feature Intersect, Facility, Location, Length, Width, Traffic Volume, Scour Critical |
| 2 | FEMA DFIRM | PASDA Link | Zone, Source Citation, Floodway |
| 3 | FEMA Depth Grid | PASDA Link | No fields displayed |
| 4 | PASDA lidar hillshade data | PASDA Link | No fields displayed, Basemap |
Scour Critical Bridges inside of Floodplain
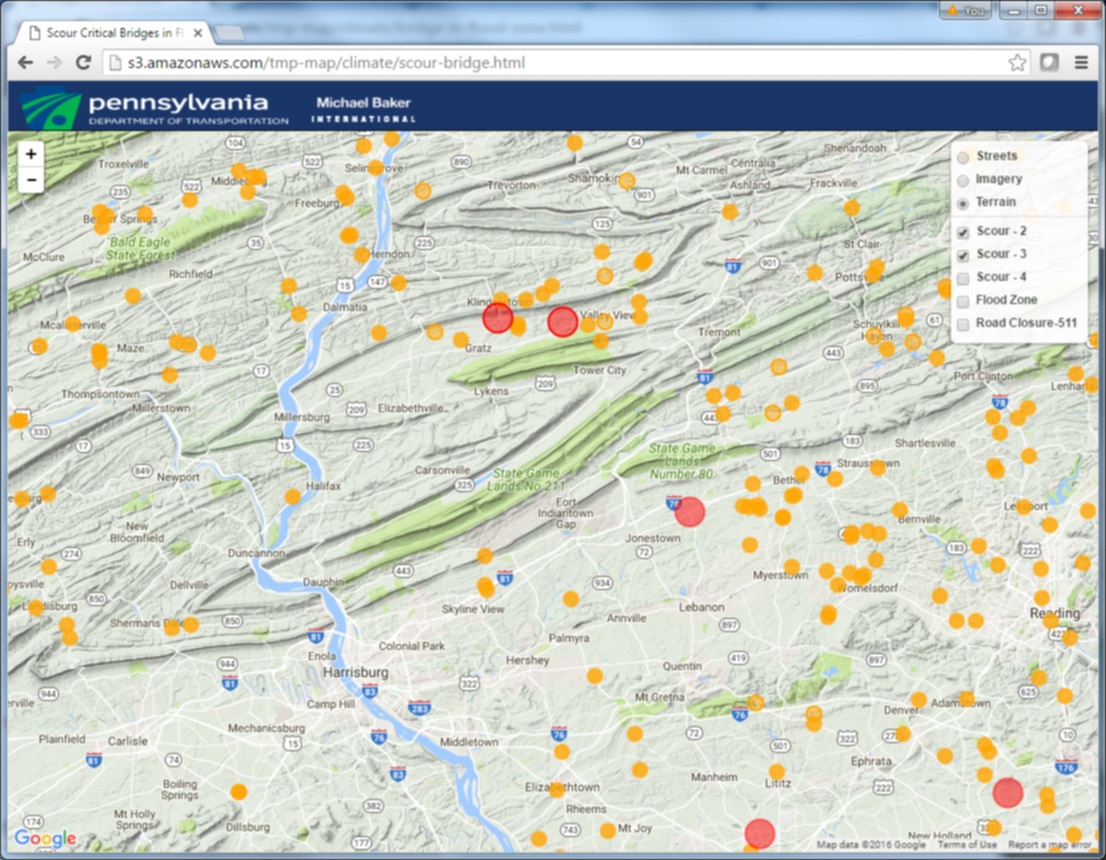
Bridges that are attributed as Scour Critical and also intersect flood zone polygons. Scour Critical bridges
are grouped into three categories:
- Scour Critical 2 - Critical; Extensive scour at foundations; immediate action required
- Scour Critical 3 - Critical; Foundations Unstable
- Scour Critical 4 - Stable; Action required to protect from further erosion
Also, each bridge is selectable and available attributes include Bridge ID, Feature Intersected, Location, Length, Width, Area, Average Daily Traffic counts and a link to Google Streetview (where available).
Additional layers available for viewing include data from PennDOT's Road Closure Reporting System(RCRS) clipped to the flood zone polygons.
Map Data Sources:
| # | Source Table | Data Link | Fields |
|---|---|---|---|
| 1 | PennDOT BMS | BMS Data Dictionary | Bridge ID, Feature Intersect, Facility, Location, Length, Width, Traffic Volume, Scour Critical |
| 2 | PennDOT RCRS | Pennshare Link | State Route, Segment Numbers, County, Functional Class |
| 3 | PASDA Floodplains | PASDA Link | No fields displayed |
All State Owned Bridges inside of Floodplain
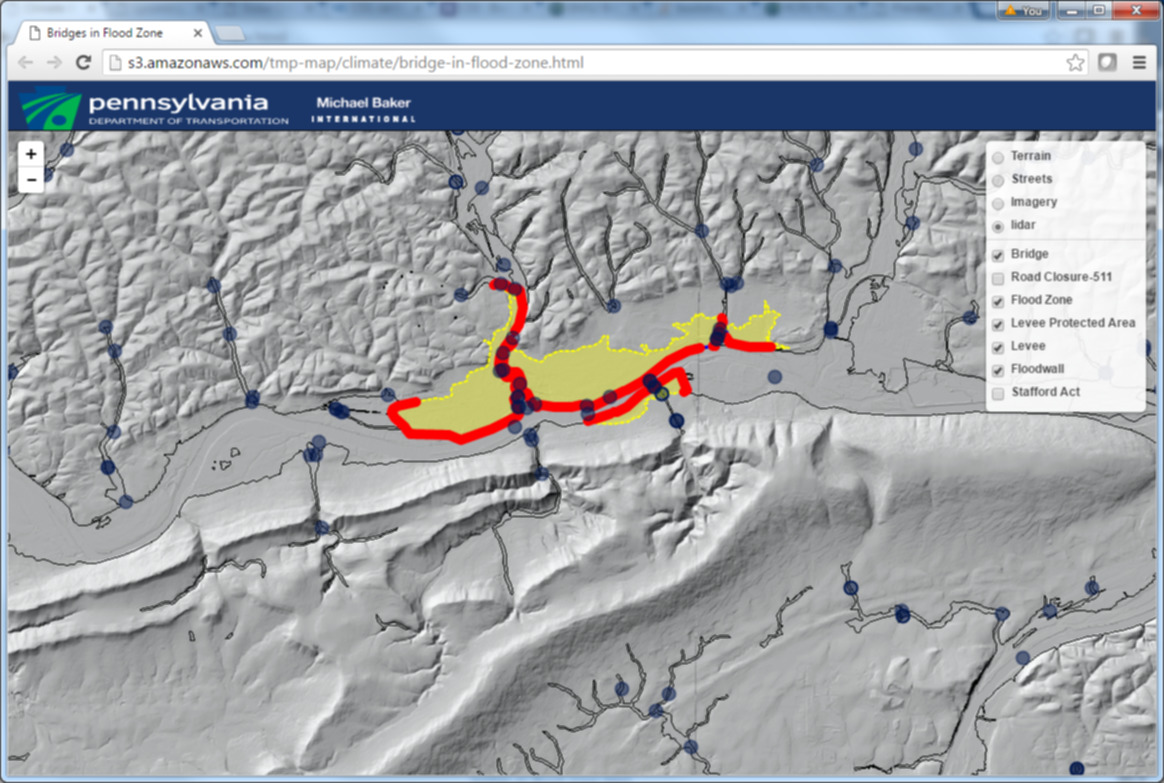
State owned bridges that intersect flood zone polygons, each bridge is selectable and available attributes include Bridge ID, Feature Intersected, Location, Length, Width, Area, Average Daily Traffic counts and a link to Google Streetview (where available).
Additional layers available for viewing include 511 Road Closure data clipped to the flood zone polygons. Army Corps of Engineers
database of Levee's & Floodwalls and properties aquired via the Stafford Act
Map Data Sources:
| # | Source Table | Data Link | Fields |
|---|---|---|---|
| 1 | PennDOT BMS | BMS Data Dictionary | Bridge ID, Feature Intersect, Facility, Location, Length, Width, Traffic Volume, Scour Critical |
| 2 | PennDOT RCRS | Pennshare Link | State Route, Segment Numbers, County, Functional Class |
| 3 | PASDA Floodplains | PASDA Link | No fields displayed |
| 4 | USACE National Levee Database | USACE Link | Feature Name, Bank Description, Capture Method, Flood Source, Basin, Last Updated |
Bridge Structural Rating inside of Floodplain
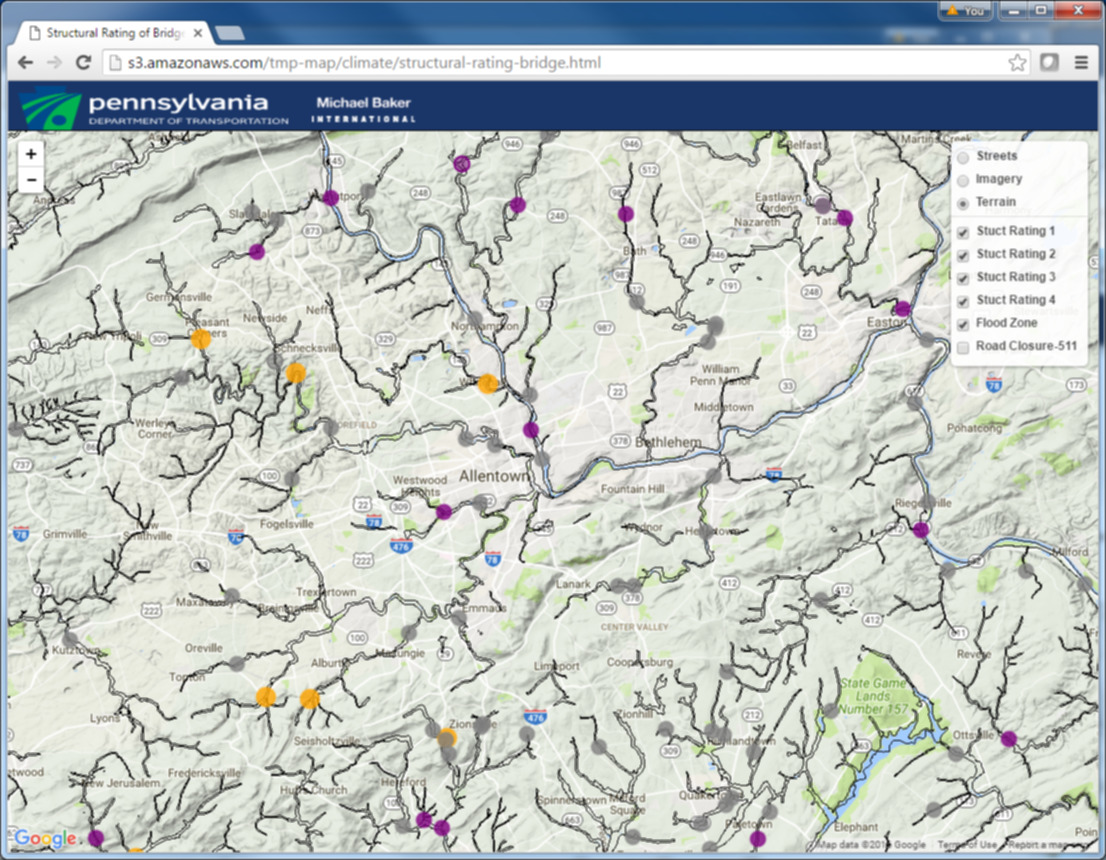
Bridges that are attributed with a Structural Evaluation Rating Code and also intersect flood zone polygons.
Structural Evaluation Rating Codes are grouped into four categories:
- Code 1 - Closed - Imediate Replacement
- Code 2 - Intolerable Condition Requires Replacement
- Code 3 - Basically Intolerable Condition Requiring High Priority Corrective Action
- Code 4 - Minimum Tolerable Requirements
Also, each bridge is selectable and available attributes include Bridge ID, Feature Intersected, Location, Length, Width, Area, Average Daily Traffic counts and a link to Google Streetview (where available).
Additional layers available for viewing include 511 Road Closure data clipped to the flood zone polygons.
Map Data Sources:
| # | Source Table | Data Link | Fields |
|---|---|---|---|
| 1 | PennDOT BMS | BMS Data Dictionary | Bridge ID, Feature Intersect, Facility, Location, Length, Width, Traffic Volume, Scour Critical |
| 2 | PennDOT RCRS | Pennshare Link | State Route, Segment Numbers, County, Functional Class |
| 3 | PASDA Floodplains | PASDA Link | No fields displayed |
Lycoming County Depth Grids
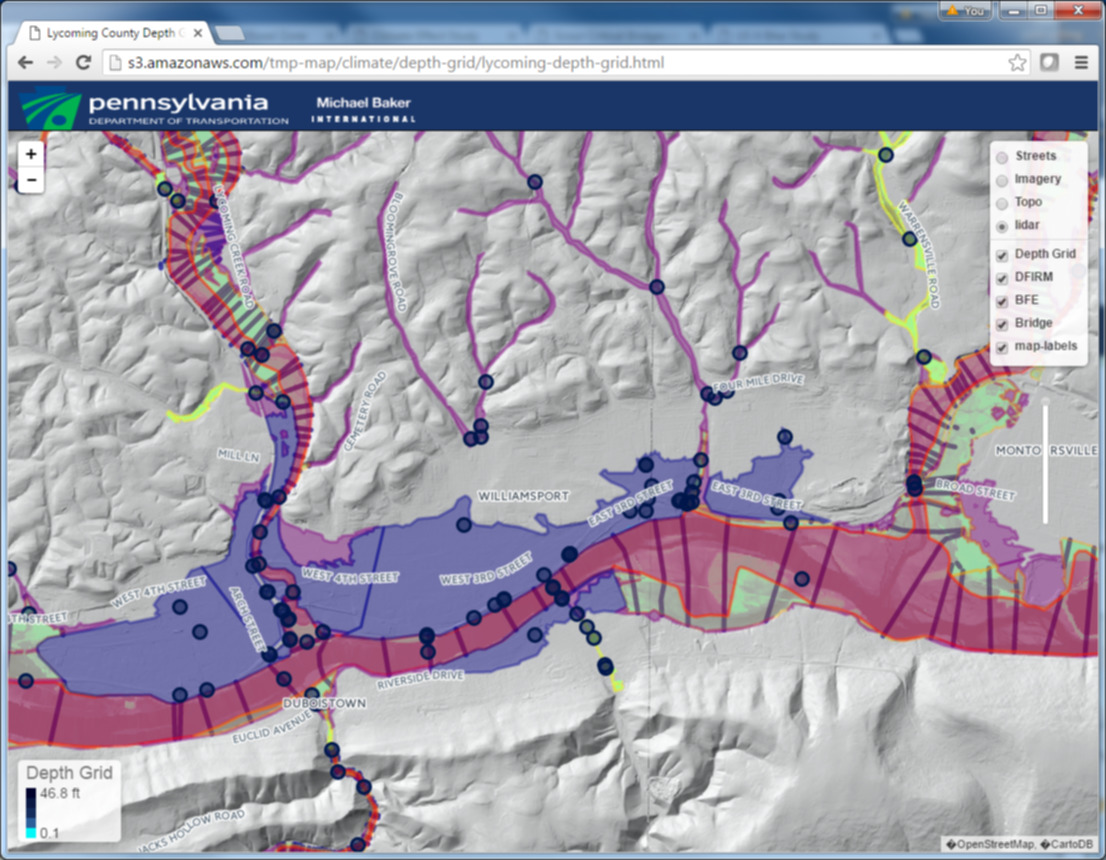
FEMA depth grids, Digitial Flood Insurance Rate Maps (DFIRM) and Base Flood Elevation data for Lycoming County.
Bridge data has been clipped to the floodzone polygons and includes attribute data such as Bridge ID, Feature Intersected, Location, Length, Width, Area, Average Daily Traffic counts and a link to Google Streetview (where available).
Map Data Sources:
| # | Source Table | Data Link | Fields |
|---|---|---|---|
| 1 | PennDOT BMS | BMS Data Dictionary | Bridge ID, Feature Intersect, Facility, Location, Length, Width, Traffic Volume, Scour Critical |
| 2 | FEMA DFIRM | PASDA Link | Zone, Source Citation, Floodway |
| 3 | FEMA Depth Grid | PASDA Link | No fields displayed |
| 4 | PASDA lidar hillshade data | PASDA Link | No fields displayed, Basemap |
Delaware County Depth Grids

FEMA depth grids, Digitial Flood Insurance Rate Maps (DFIRM) and Base Flood Elevation data for Delaware County.
Bridge data has been clipped to the floodzone polygons and includes attribute data such as Bridge ID, Feature Intersected, Location, Length, Width, Area, Average Daily Traffic counts and a link to Google Streetview (where available).
Map Data Sources:
| # | Source Table | Data Link | Fields |
|---|---|---|---|
| 1 | PennDOT BMS | BMS Data Dictionary | Bridge ID, Feature Intersect, Facility, Location, Length, Width, Traffic Volume, Scour Critical |
| 2 | FEMA DFIRM | PASDA Link | Zone, Source Citation, Floodway |
| 3 | FEMA Depth Grid | PASDA Link | No fields displayed |
| 4 | PASDA lidar hillshade data | PASDA Link | No fields displayed, Basemap |
Allegheny County Depth Grids
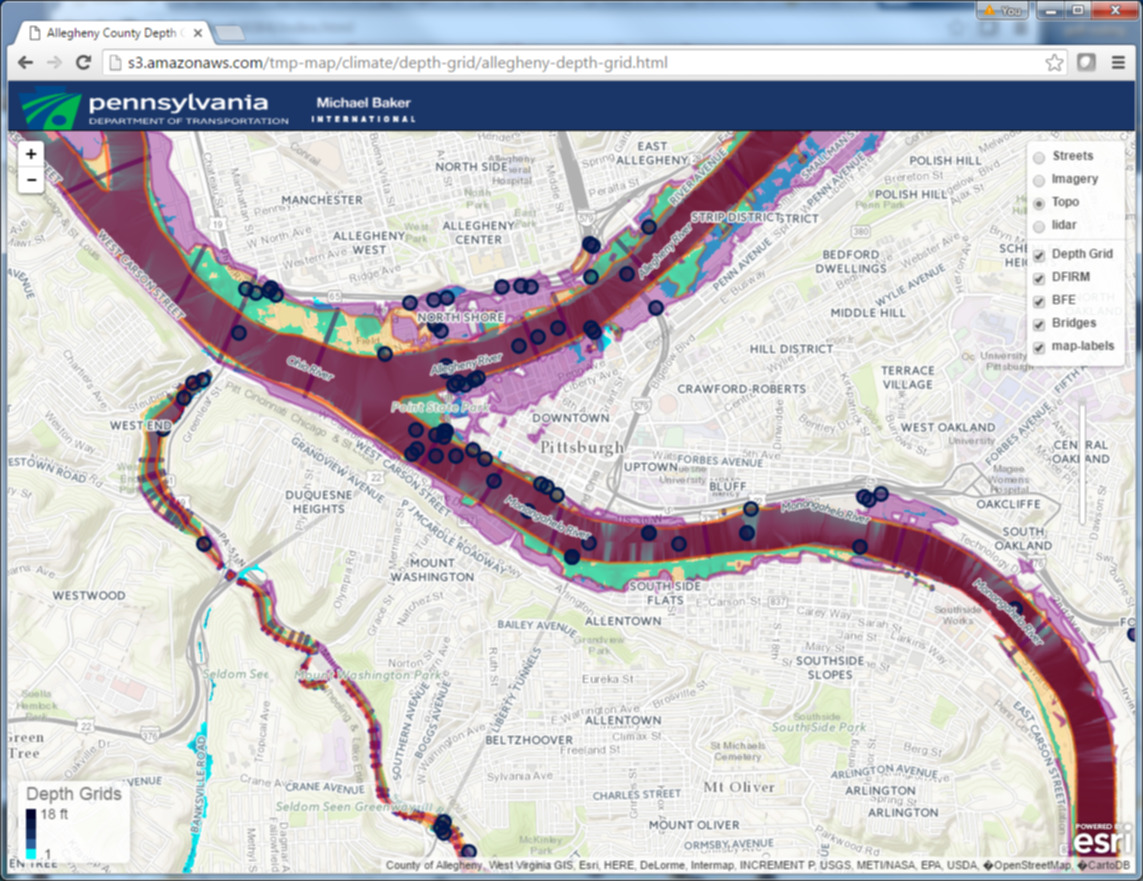
FEMA depth grids, Digitial Flood Insurance Rate Maps (DFIRM) and Base Flood Elevation data for Allegheny County.
Bridge data has been clipped to the floodzone polygons and includes attribute data such as Bridge ID, Feature Intersected, Location, Length, Width, Area, Average Daily Traffic counts and a link to Google Streetview (where available).
Map Data Sources:
| # | Source Table | Data Link | Fields |
|---|---|---|---|
| 1 | PennDOT BMS | BMS Data Dictionary | Bridge ID, Feature Intersect, Facility, Location, Length, Width, Traffic Volume, Scour Critical |
| 2 | FEMA DFIRM | PASDA Link | Zone, Source Citation, Floodway |
| 3 | FEMA Depth Grid | PASDA Link | No fields displayed |
| 4 | PASDA lidar hillshade data | PASDA Link | No fields displayed, Basemap |
RCRS and 1 Day Observed Precipitation
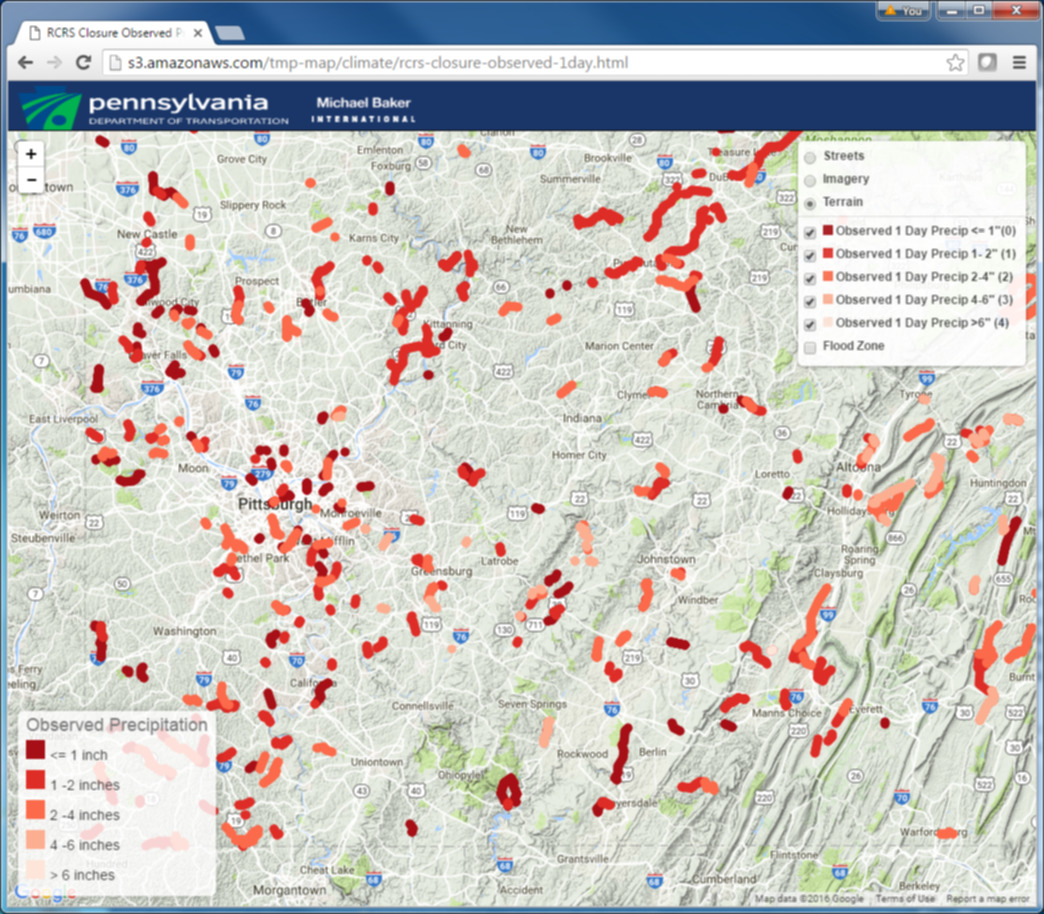
rcrs-closure-observed-1day.html
RCRS data compared to Precipitation on Day of Closure, RCRS is classified by inches of precipitation observed on the day of closure.
Map Data Sources:
| # | Source Table | Data Link | Fields |
|---|---|---|---|
| 1 | NOAA | NOAA Atlas 14 | Precipitation Total, Date |
| 2 | PennDOT RCRS | Pennshare Link | Date Closed, Precipitation Classification, State Route, Segment Numbers, County |
| 3 | PASDA Floodplains | PASDA Link | No fields displayed |
RCRS and 4 Day Observed Precipitation
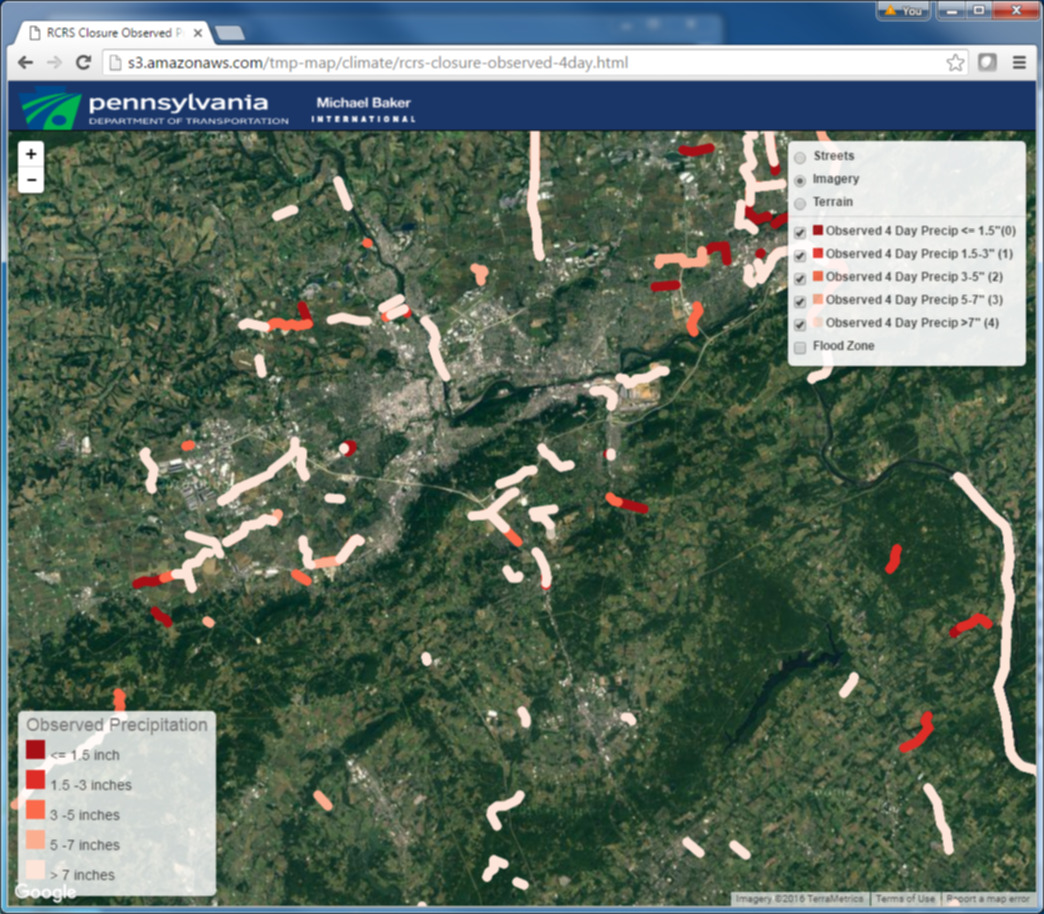
rcrs-closure-observed-4day.html
RCRS data compared to Precipitation on Day of Closure and three days prior, RCRS is classified by inches of precipitation observed on Day of Closure and three days prior.
Map Data Sources:
| # | Source Table | Data Link | Fields |
|---|---|---|---|
| 1 | NOAA | NOAA Atlas 14 | Precipitation Total, Date |
| 2 | PennDOT RCRS | Pennshare Link | Date Closed, Precipitation Classification, State Route, Segment Numbers, County |
| 3 | PASDA Floodplains | PASDA Link | No fields displayed |
RCRS and 1 Day Precipitation Average

RCRS data compared to Precipitation on Day of Closure, RCRS is classified by Average Recurrance Interval.
The NOAA Atlas 14 is the official documentation of precipitation frequency estimates and associated information for the United States. This Atlas provides precipitation frequency estimates for 5-minute through 60-day durations at average recurrence intervals of 1-year through 1,000-year. The estimates are based on the analysis of annual maximum series and then converted to partial duration series results. The Precipitation Frequency Data Server (PFDS) was developed and published in tandem with this Atlas to allow for the download of digital files including ArcInfo ASCII grids and ESRI shapefiles.
The data were used to classify road closures based on how often the precipitation frequency. The ASCII grids for one day totals of one year, 10 year, 50 year, and 100 year average recurrences and four day totals of one year, 10 year, 50 year, and 100 year average recurrences were converted to shapefiles and joined to each road closure segment. The data were compared to the observed amount for each closure date and classified according to the following rules for one day and 4 day totals to determine the most at-risk road segments:
- Code 1 - Less than 1 Year Average
- Code 2 - 1 Year Average - 10 Year Average
- Code 3 - 10 Year Average - 50 Year Average
- Code 4 - 50 Year Average - 100 Year Average
- Code 5 - Greater than 100 Year Average
Map Data Sources:
| # | Source Table | Data Link | Fields |
|---|---|---|---|
| 1 | NOAA | NOAA Atlas 14 | Precipitation Total, Date |
| 2 | PennDOT RCRS | Pennshare Link | Date Closed, Precipitation Classification, State Route, Segment Numbers, County |
| 3 | PASDA Floodplains | PASDA Link | No fields displayed |
RCRS and 4 Day Precipitation Average
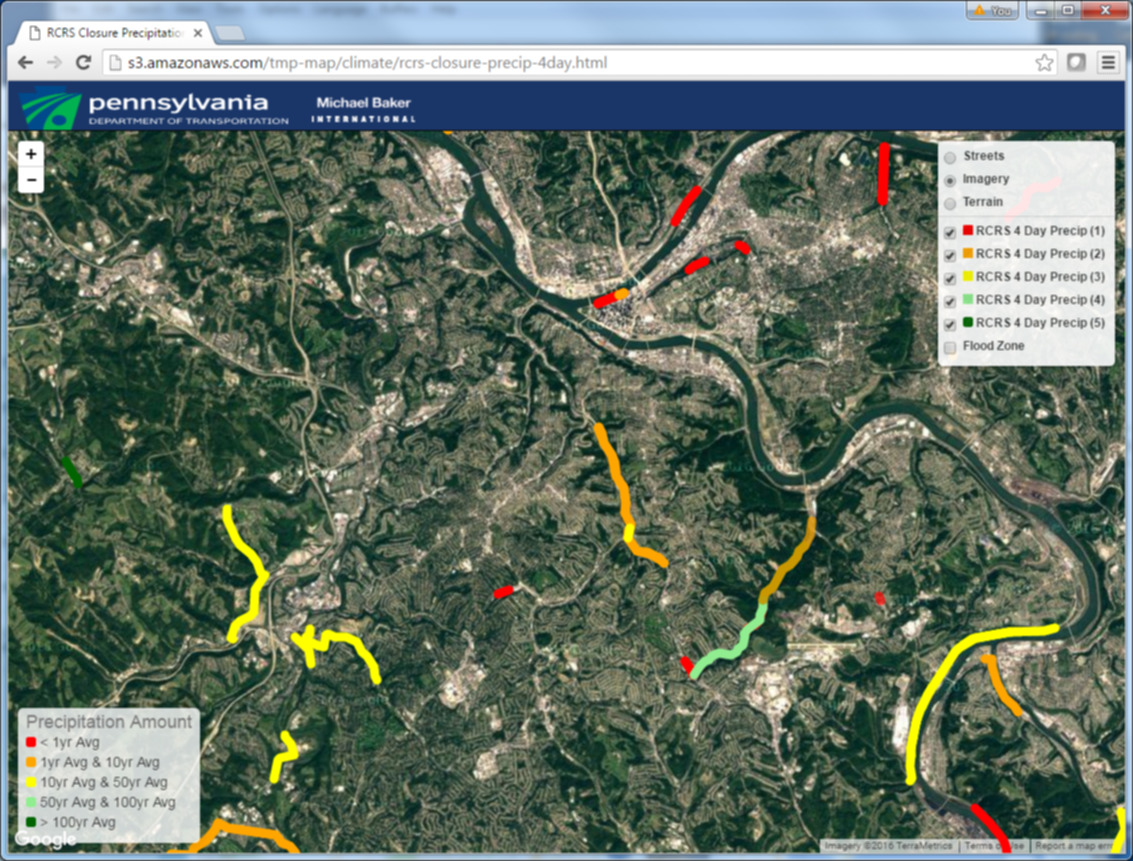
RCRS data compared to Precipitation over a 4 Day Total, RCRS is classified by Average Recurrance Interval.
The NOAA Atlas 14 is the official documentation of precipitation frequency estimates and associated information for the United States. This Atlas provides precipitation frequency estimates for 5-minute through 60-day durations at average recurrence intervals of 1-year through 1,000-year. The estimates are based on the analysis of annual maximum series and then converted to partial duration series results. The Precipitation Frequency Data Server (PFDS) was developed and published in tandem with this Atlas to allow for the download of digital files including ArcInfo ASCII grids and ESRI shapefiles.
The data were used to classify road closures based on how often the precipitation frequency. The ASCII grids for one day totals of one year, 10 year, 50 year, and 100 year average recurrences and four day totals of one year, 10 year, 50 year, and 100 year average recurrences were converted to shapefiles and joined to each road closure segment. The data were compared to the observed amount for each closure date and classified according to the following rules for one day and 4 day totals to determine the most at-risk road segments:
- Code 1 - Less than 1 Year Average
- Code 2 - 1 Year Average - 10 Year Average
- Code 3 - 10 Year Average - 50 Year Average
- Code 4 - 50 Year Average - 100 Year Average
- Code 5 - Greater than 100 Year Average
Map Data Sources:
| # | Source Table | Data Link | Fields |
|---|---|---|---|
| 1 | NOAA | NOAA Atlas 14 | Precipitation Total, Date |
| 2 | PennDOT RCRS | Pennshare Link | Date Closed, Precipitation Classification, State Route, Segment Numbers, County |
| 3 | PASDA Floodplains | PASDA Link | No fields displayed |
RCRS Data Grouped by Closure Event Type
RCRS data classified by comments field.
- Type 1 - Flood
- Type 2 - Ice - Snow
- Type 3 - Erosion
- Type 4 - Landslide
- Type 5 - Wind
Map Data Sources:
| # | Source Table | Data Link | Fields |
|---|---|---|---|
| 1 | PennDOT RCRS | Pennshare Link | Date Closed, Precipitation Classification, State Route, Segment Numbers, County |
| 2 | PASDA Floodplains | PASDA Link | No fields displayed |
RCRS data filtered by date
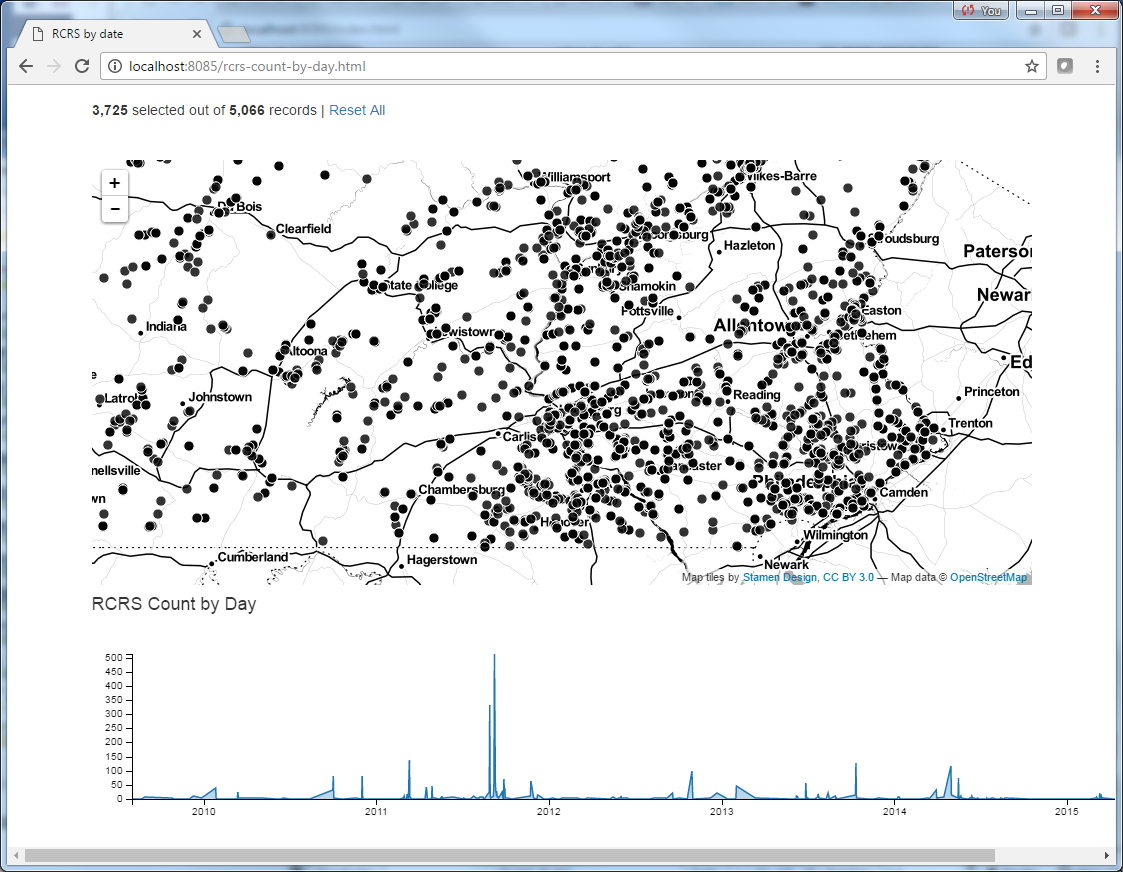
RCRS data filtered by date