 Share this Page
QBVIZ
QbViz is a lightweight actionscript library aimed at collaborative data visualization. Its main purpose is to simplify the creation of web applications capable of accessing fairly complex data sources, render them as interactive 3d visualizations, and share the created views among a set of remote users connected to the same virtual workspace. QbViz makes use of Flash Remoting as its communication platform. A simple set of QbViz server components (Data and Workspace services) are currently implemented as .Net Framework objects, even if other technologies can be considered for server-side developement. The communication between client and server components flows through a flash remoting gateway (WebOrb) installed as a normal ASP.Net application on a ASP.Net-capable web server.
THE VISUALIZATION PIPELINE
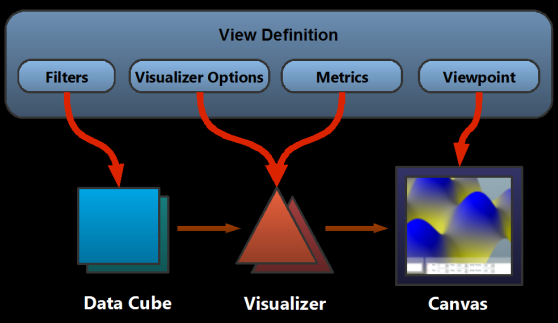
The central element of a QbViz application is the View. A View is simply a visual representation of one or more sources of data. In QbViz, three main elements are involved in the process of creating of a View: DataCubes, Visualizers, and the Canvas.
DataCubes locally store the actual data that will be used to generate the visualization. DataCubes are obtained trough queries to Data Services. Data Services allow the access to remote data sources, and fill the local DataCubes with the requested data. Queries are essentially composed by a set of filters that determine the properties of desired data (ie space boundaries, time reference, detail levels and so on).
Visualizers perform the mapping process between numberic data and its visual reprensentation. Different visualizer implementations generate different visualization of the same DataCube. Visualizers can implement generic visualization metaphors (ie the mapping of a scalar field to a 3d heightmap), or define application-specific visualization techniques. In its current version, QbViz does not expose any generic visualizer library, and visualizer implementations should be part of the application codebase. A set of generic visualizers may be available in future versions. A visualizer requires three input elements:
- A DataCube containing data to be visualized.
- A set of Visualizer-specific options that control the way the visualization is generated (ie color gradients, opacities, tessellation levels, ...)
- A set of Metrics used to convert numeric units (meters, seconds, ...) used in source data to nondimensional 3d units used by the visualization. Unlike visualizer-specific options, metrics are shared by all the visualizers which are part of the same view. This greatly helps in the creation of consistent views, and simplifies dimension scaling operations.
The Canvas represents the viewport in which the View will actually be rendered. Viewpoint options determine the position from which data is looked at.
Filters, Visualizer Options, Metrics and the Viewpoint all together form a View Definition. A View Definition is a simple data structure that completely defines how a View should be created. Given a view definition, a QbViz application should be able to:
- connect to the requested Data Services (if available);
- obtain correctly filtered data cubes;
- istantiate needed visualizers, attach them to related data cubes and set up their parameters;
- setup the canvas viewpoint.
COLLABORATIVE FEATURES
View definition objects are relatively lightweight data structures. They can be easily exchanged between remote users, carrying around informations on how to build visualizations from client to client. The controlled exchange of view definitions is actually the basis of cooperative services offered by QbViz.
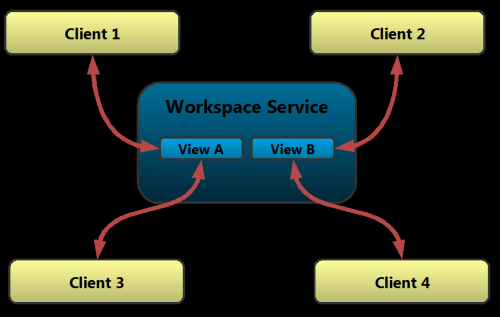
The core of QbViz cooperative functionality is the Workspace Service. A workspace service acts mainly as a repository of views. Users can publish their views on a workspace or connect to views published by others to participate in a cooperative session. It is worth noticing that users connected to the same workspace may be participating to different cooperative sessions. As an example in the picture above clients 1 and 3 are cooperating on view A while clients 2 and 4 are working on view B. Being connected to the same workspace though, all the clients will be able to see newly published views by other users, connect to any of the published views and send chat messages to a common workspace room. As underlined above, cooperation is achieved mainly by sending around view definition updates. The cooperation metaphor (ie the way in wich users will actually collaborate in a cooperative session) can be described by two main factors:
- Which components of a view definition are part of update messages (a subset of filters, visualizer options, metrics, viewpoint definition);
- What is the filter policy used by single client in sending and receiving those updates.
- Camera updates carry only the viewpoint component of a view definition;
- View updates carry a complete view definition.
- Input (I): a client will accept updates from other clients;
- Output (O): a client will broadcast local updates to other clients;
- Input-Output (IO): all of the above.
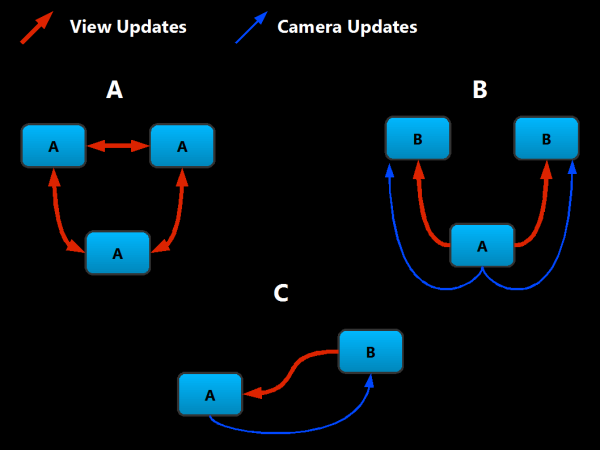
- in Diagram A three clients cooperate in defining the contents of the view, but each client has his own independent viewpoint;
- in Diagram B a single client determines both view content and the viewpoint, and sends updates to two clients wich act as passive viewers;
- Diagram C shows an exotic, yet possible, cooperative configuration: a client chooses the viewpoint while the other one determines view contents.