 Share this Page
Endurance
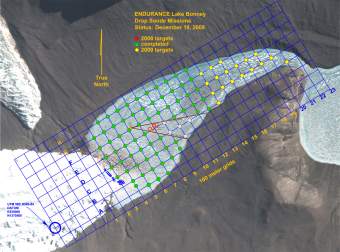
For this project, we had to build a program to visualize data gathered during the ENDURANCE project exploration of Lake Bonney, Antarctica, in winter 2008.
Source Data
Converting Data
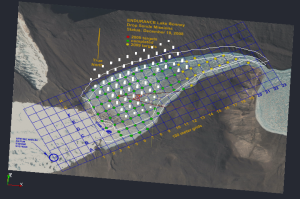 The source data has been initially converted to an unstructured grid in the vtk legacy format, to simplify
its loading inside the application, and to be able to preview the data using ParaView. Through paraview, it was
possible to transform the different sets of data (the bathymetry, overlay and sonde dataset) to match their
position. The transformations could then be easily reapplied inside the application. ParaView has also been
used to generate a volumetric representation of data. This representation has been exported into a separate
unstructured grid.
The source data has been initially converted to an unstructured grid in the vtk legacy format, to simplify
its loading inside the application, and to be able to preview the data using ParaView. Through paraview, it was
possible to transform the different sets of data (the bathymetry, overlay and sonde dataset) to match their
position. The transformations could then be easily reapplied inside the application. ParaView has also been
used to generate a volumetric representation of data. This representation has been exported into a separate
unstructured grid.The Visualization Pipeline
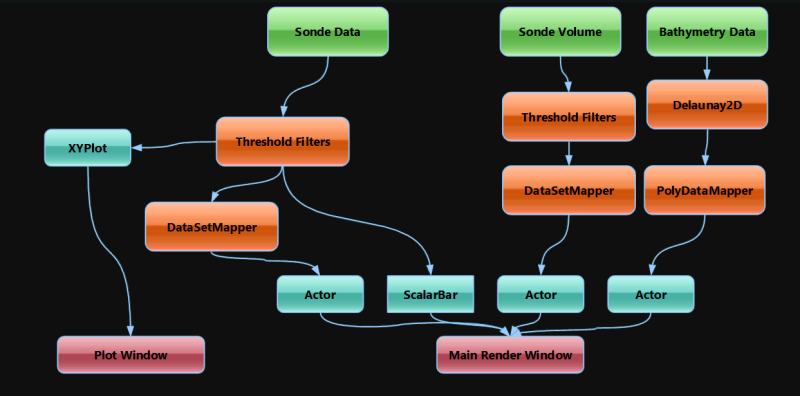
The visualization pipeline built for the application loads three basic data sources:
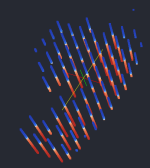
- The sonde data unstructured grid
- The sonde data volume unstructured grid
- The lake bathymetry datapoints
The Application
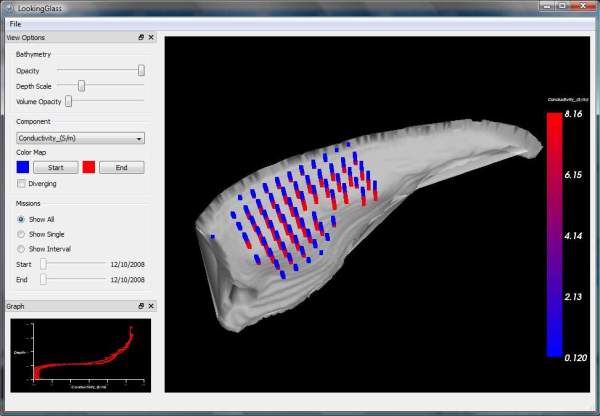
- Left mouse click: Rotates the view.
- middle mouse click: Translates the view.
- right mouse click: Pans the view.
View Options
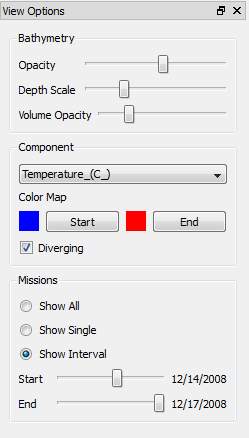 The View Options Sidebar is divided into three main areas:
- Bathymetry Options: this section allows to configure the overall depth scale of the visualization, the opacity of the bathymetric model, and the opacity of the sonde data volumetric model.
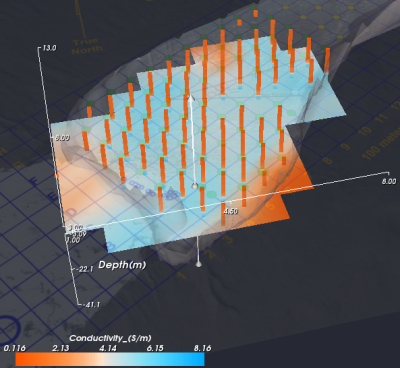
- Component Options: in this section it is possible to select which component of the source dataset is currently visualized, and to select the color map used to represent the sonde data. both the sonde points and the volumetric representation get updated using the color transfer function defined here.
- Mission Options: this section allows the user to choose which mission or subset of missions should be currently visualized.
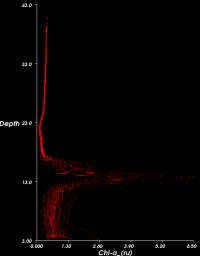 When modifying the set of currently visualized missions, or changing the currently visualized data component,
the data plot gets automatically updated to show the corresponding selected information.
When modifying the set of currently visualized missions, or changing the currently visualized data component,
the data plot gets automatically updated to show the corresponding selected information.
Volume Rendering

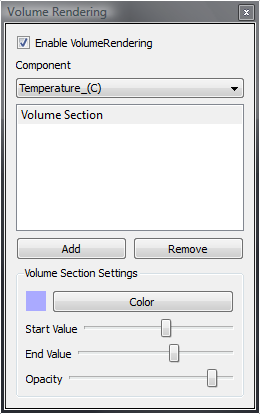 Through a separate dock it is possible to access volume rendering options. Volume rendering is performed
using software raycasting. It is possible to specify up to 10 transfer function ranges for volume
surface extraction, each one with its own color and opacity.
Through a separate dock it is possible to access volume rendering options. Volume rendering is performed
using software raycasting. It is possible to specify up to 10 transfer function ranges for volume
surface extraction, each one with its own color and opacity.
Slicing
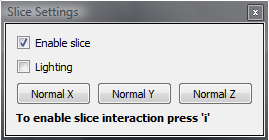 The application aslo supports the visualization of a custom slice of data. Is is possible to manipulate
the slicing plane directly inside the render window, or the user can choose to slice along one of the three
main axes.
The application aslo supports the visualization of a custom slice of data. Is is possible to manipulate
the slicing plane directly inside the render window, or the user can choose to slice along one of the three
main axes.
Docking
Using docking, it is also possible to customize the interface to allocate all of the available application space to the visualization. The view options are still avaliable, selecting the corresponding tab on the bottom of the application window.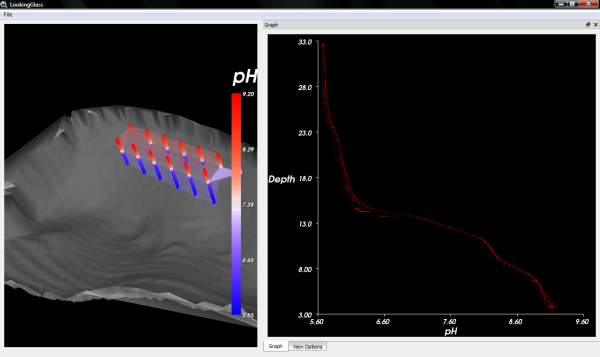
Conclusion
Download the application source code, datafiled and Win32 executable HERE.Things to do
- Revise the interaction style used for the main visualization (perhaps using a terrain-like interaction scheme).
- Add support for custom slice visualization. (Possibly using a best interaction style than
the default vtk one. ParaView offers much a much better interaction system to handle data slicing.
- Export sonde volume data as a structured grid. Delaunay3D generates tethraedral data. This does not seem to be ok if we want to manipulate real volumetric data.
- Support the selection of single grid points to plot specific data.
- Support multiple plots, and plots against components other than depth.
- Support view snapshots and annotations.