 Share this Page
Chindogu Viz
For this first project we had to come up with a good idea on how to build a physical visualization of data coming from the US Environmental Protection Agency, reporting mainly information about air quality and pollutant concentration over time and across the United States.
Brainstorming
 When I started thinking about what kind of visualization I could build out of the data,
I came out with several different ideas: after some initial experiment I had to drop a couple
of them because I soon realized they were not working as I expected. I was then left with another
pair of choices, but neither of them was really satisfying me. The reason I was not happy with those
visualization concepts was that they were really close to being just a physical 3D representation
of a visualization I would have done using a computer. What I really wanted to do was to try and represent
the data using a completely different approach. The problem was that, given the type of data, every
exotic visualization that came into my mind was worse than its traditional counterparts, or it was just
completely silly... This somewhat reminded me of Chindogu...
When I started thinking about what kind of visualization I could build out of the data,
I came out with several different ideas: after some initial experiment I had to drop a couple
of them because I soon realized they were not working as I expected. I was then left with another
pair of choices, but neither of them was really satisfying me. The reason I was not happy with those
visualization concepts was that they were really close to being just a physical 3D representation
of a visualization I would have done using a computer. What I really wanted to do was to try and represent
the data using a completely different approach. The problem was that, given the type of data, every
exotic visualization that came into my mind was worse than its traditional counterparts, or it was just
completely silly... This somewhat reminded me of Chindogu...
Chindogu
Chindogu (literally: unusual tool) is the Japanese art of creating tools with the purpose of solving everyday problems: the drawback is that these tools are so awkward (or embarassing...) to use that it becomes pointless to use them to solve the problem they were intended for... Well... why not try this on a visualization and see what actually comes out?Simple Guide to Building an Awkward Visualization
My objective for this project became to build a visualization that:- Used a completely different way of representing data: something that just could not be put on a display.
- Was formally correct (i.e. it actually contained the data I wanted to visualize)
- Was intuitive to use (after a brief explanation or through a legend)
Choosing Data
I decided to represent data for two pollutants (carbon monoxide and particulate matter) over a period of seven years, and for seven different sites in Illinois. The sites were choosen as to have almost complete data for both pollutants in the considered time period (2001 - 2007). Also, I chose to represent national trends for the two pollutants in the same period. I took the data from time graphs and put it on a spreadsheet to be able to easily consult it later on. The total number of datapoints is 2(pollutants) x 7(years) x (7 + 1)(sites + national trend) = 112 datapoints.Ingredients
 This is the list of things I used to build my Chindogu visualization:
- Hard box paper.
- Some wood boards left after assembling a piece of Ikea furniture...
- Styrofoam.
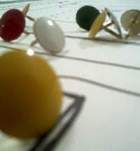
- Colored thumbtacks.
- 2 medicine dispensers.
- Cotton Swabs.
- Lots and lots of pennies.
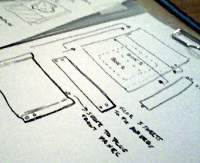
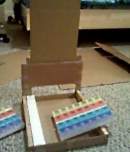 Having planned the project construction steps on paper, building it was pretty straightforward.
The basic visualization skeleton consists of a map of the chosen area (Illinois) with an indication of
each considered site. Each site is linked with a set of small, closed boxes. Each one of the boxes is tagged
with a year. Thus, opening a box unveils data for a specific site, at a specific year. Of course, more boxes
can be opened at the same time to 'show' more data. The entire process is extremely intuitive. One can
open a row of boxes, to show time varying data for the same site, open a column to show data for a specific
year in different sites, or open an arbitrary region. Only data the user is specifically interested in gets
shown.
Having planned the project construction steps on paper, building it was pretty straightforward.
The basic visualization skeleton consists of a map of the chosen area (Illinois) with an indication of
each considered site. Each site is linked with a set of small, closed boxes. Each one of the boxes is tagged
with a year. Thus, opening a box unveils data for a specific site, at a specific year. Of course, more boxes
can be opened at the same time to 'show' more data. The entire process is extremely intuitive. One can
open a row of boxes, to show time varying data for the same site, open a column to show data for a specific
year in different sites, or open an arbitrary region. Only data the user is specifically interested in gets
shown.
Adding Data
 After the basic visualization structure was built, It was time to actually add data to it
(that is, fill the boxes). Each box had to contain data about two pollutants.
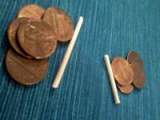
This data was represented through... pennies and cotton swab sticks. In particular:
After the basic visualization structure was built, It was time to actually add data to it
(that is, fill the boxes). Each box had to contain data about two pollutants.
This data was represented through... pennies and cotton swab sticks. In particular:
- The number of pennies was used to represent the level of Carbon Monoxide.
- The length of the cotton swab stick was used to represent the level of Particulate Matter.
Why this is NOT a Good Visualization
First of all, It is worth noting how this way of representing the chosen dataset respects the criteria of being formally correct and intuitive:- It correctly represents all the data: even if data in presented in an approximate, discretized form it is still possible to compare different datapoints to have a qualitative feeling of how pollutant concentrations change over time and in different places.
- Accessing and interpreting information from a specific datapoint is straightforward.
- First of all, the representation of a single datapoint, even if easy to explain, is complex to process. To understand the content of a datapoint I would have to count the number of pennies and / or interpret the length of the stick. Lots of times this will require actually taking these objects out of their box and handle them together with the contents of another box to understand their meaning. This also mean that observing time varying data from the same site, or comparing more than two datapoints becomes extremely complex.
- Another wrong feature in the visualization is the presence of data filtering (i.e. opening and closing the boxes). Filtering is in general useful when a dataset is too big to be effectively perceived all at the same time. This is not the case of the current dataset, since it would be possible to completely display it without confusing the user. In this case, filtering becomes an unnecessary burden. It is significant to underline how filtering here is not bad because it is not intuitive: it is actually pretty easy to understand how it works. It is bad because it adds complexity to the interaction without bringing any significant advantage in communicating the meaning of data.
Conclusion
 I realize what I did on this project is pretty different from the actual requirements. We were supposed
to do a physical visualization right, while I did it explicitly wrong in part. Nonetheless, I found extremely
interesting to see what are the effects of breaking one 'guideline' in the design of a visualization, while
respecting the others. Communicating information to the user is probably the single most important aspect
of visualization. This is the reason why failing this point turned my novel data representation approach
into a Chindogu :) Breaking a different rule, while still negative, may have a less
'destructive' impact on the final result. For instance, designing a less intuitive representation, may bring
initial confusion to the user, or could require a longer training. But once the user understands how the
visualization 'works', he can still get useful information from it, suffering a lighter penalty in terms
of efficiency.
I realize what I did on this project is pretty different from the actual requirements. We were supposed
to do a physical visualization right, while I did it explicitly wrong in part. Nonetheless, I found extremely
interesting to see what are the effects of breaking one 'guideline' in the design of a visualization, while
respecting the others. Communicating information to the user is probably the single most important aspect
of visualization. This is the reason why failing this point turned my novel data representation approach
into a Chindogu :) Breaking a different rule, while still negative, may have a less
'destructive' impact on the final result. For instance, designing a less intuitive representation, may bring
initial confusion to the user, or could require a longer training. But once the user understands how the
visualization 'works', he can still get useful information from it, suffering a lighter penalty in terms
of efficiency.