Monitoring Virtual Replication Appliances – The SETUP Tab – The VRAs Tab
You can monitor information about all the VRAs for the local site in the VRAs subtab under the SETUP tab. You can also drill-down to monitor information about a specific VRA displayed in the VRAs tab:
Monitoring VRAs – The VRAs Tab
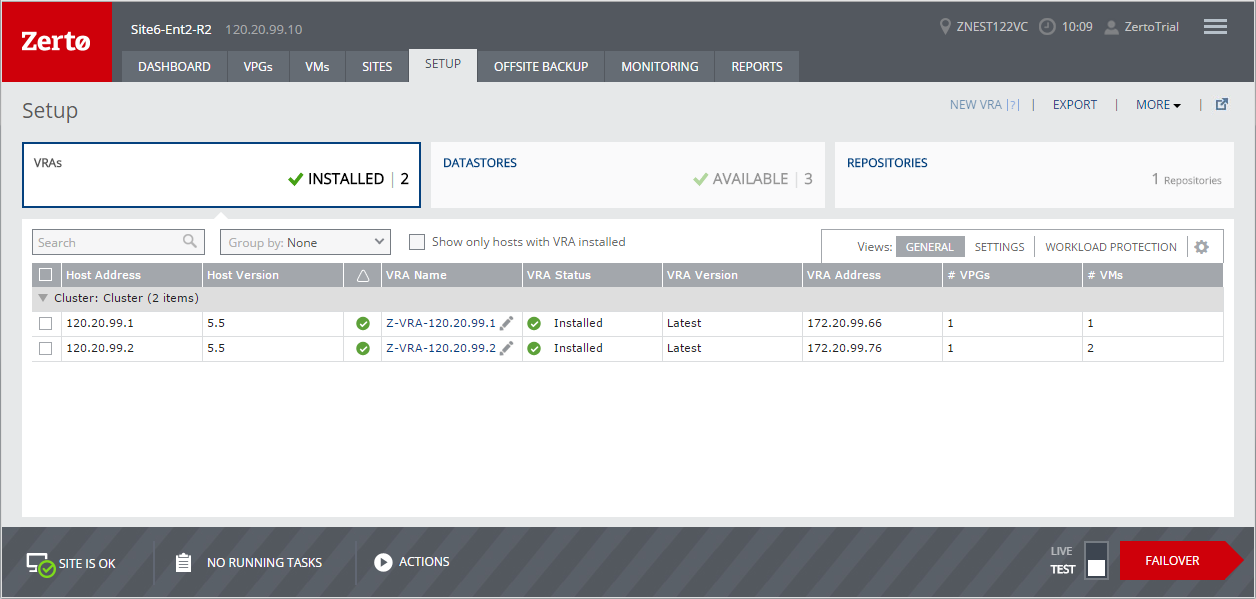
View details of the VRAs in the VRAs subtab, under the SETUP tab. All the hosts in the local hypervisor manager are listed, and details of VRAs for each host, when installed, are also shown.
You can filter information in columns via the filter icon next to each column title. You can also sort the list by each column.
General View
In this view, the number of installed VRAs is displayed in the VRAs tab. The following information is displayed in this view:
Cluster – The cluster name, if relevant.
Host Address – The host IP address for the VRA. If the host is part of a cluster, the cluster name is displayed with the hosts under the cluster.
Host Version – The host version.
Alert Status – The status of alerts in the VRA virtual machine.
VRA Name – The name of the VRA virtual machine.
VRA Status – The VRA status. For example, Installed or Ghost VRA.
VRA Version – Either Latest if the version installed is the most current version or Outdated if it can be upgraded. A tooltip displays the actual version.
VRA Address – The IP address of the VRA virtual machine.
# VPGs – The number of VPGs with a virtual machine for which the VRA either manages the protection or the recovery of the data.
# VMs – The number of virtual machines managed by the VRA.
SETTINGS View
The following information is displayed in the SETTINGS view:
VRA Group – The group of VRAs to which this VRA belongs. When VRAs use different networks, they can be grouped by network.
VRA RAM – The amount of memory allocated to the VRA to buffer data before it is sent to the recovery site or at the recovery site before it is written to the journal.
Datastore – The datastore used by the VRA.
Datastore Cluster – The datastore cluster used by the VRA, if relevant.
WORKLOAD PROTECTION View
The following information is displayed in the WORKLOAD PROTECTION view:
# VPGs – The number of VPGs with a virtual machine for which the VRA is used either for protection or recovery.
# VMs – The number of virtual machines for which the VRA is used either for protection or recovery.
# of Protected VPGs – The number of VPGs with a virtual machine for which the VRA manages the protection of their data.
# of Protected VMs – The number of virtual machines for which the VRA manages the protection of their data.
# of Protected Volumes – The number of volumes for which the VRA manages the protection of their data.
# of Recovery VPGs – The number of VPGs with a virtual machine for which the VRA manages the recovery of their data.
# of Recovery VMs – The number of virtual machines for which the VRA manages the recovery of their data.
# of Recovery Volumes – The number of volumes for which the VRA manages the recovery of their data.
Additional Fields
There are additional fields that you can display that are listed when you select
Show/Hide Columns from the dropdown list shown by clicking the configuration icon (

):
Cluster - The cluster with the host used by the VRA.
VC Network– The network used by the VRA.
# Volumes – The number of volumes for which the VRA manages the protection or recovery of data.
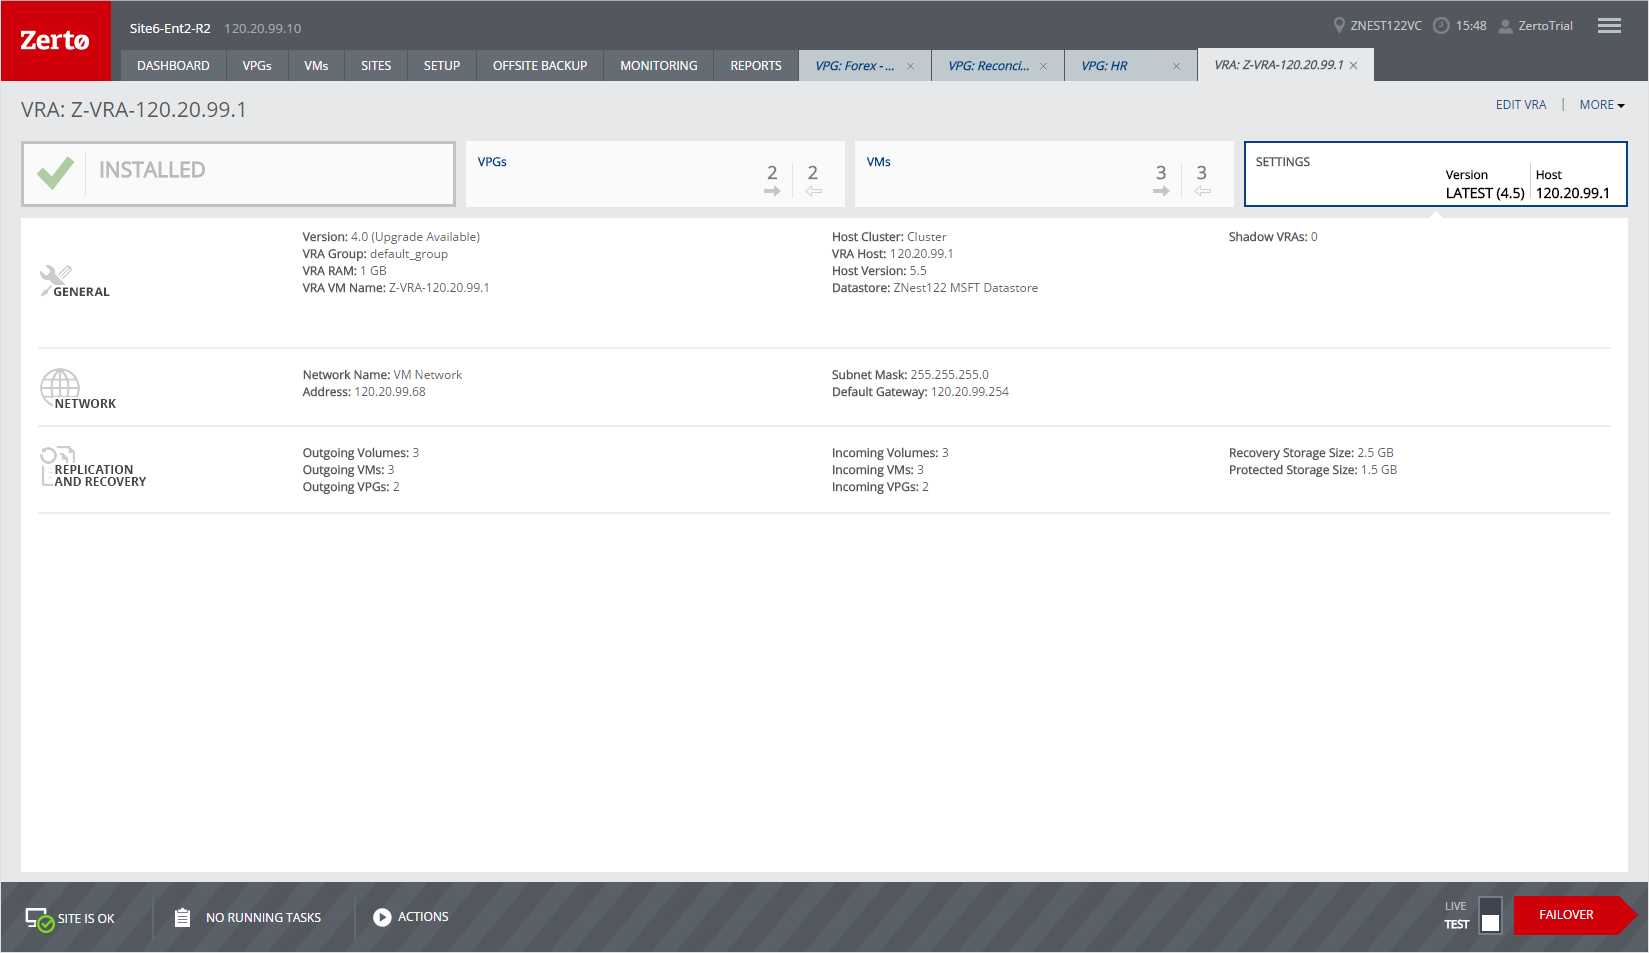
Monitoring a Single VRA
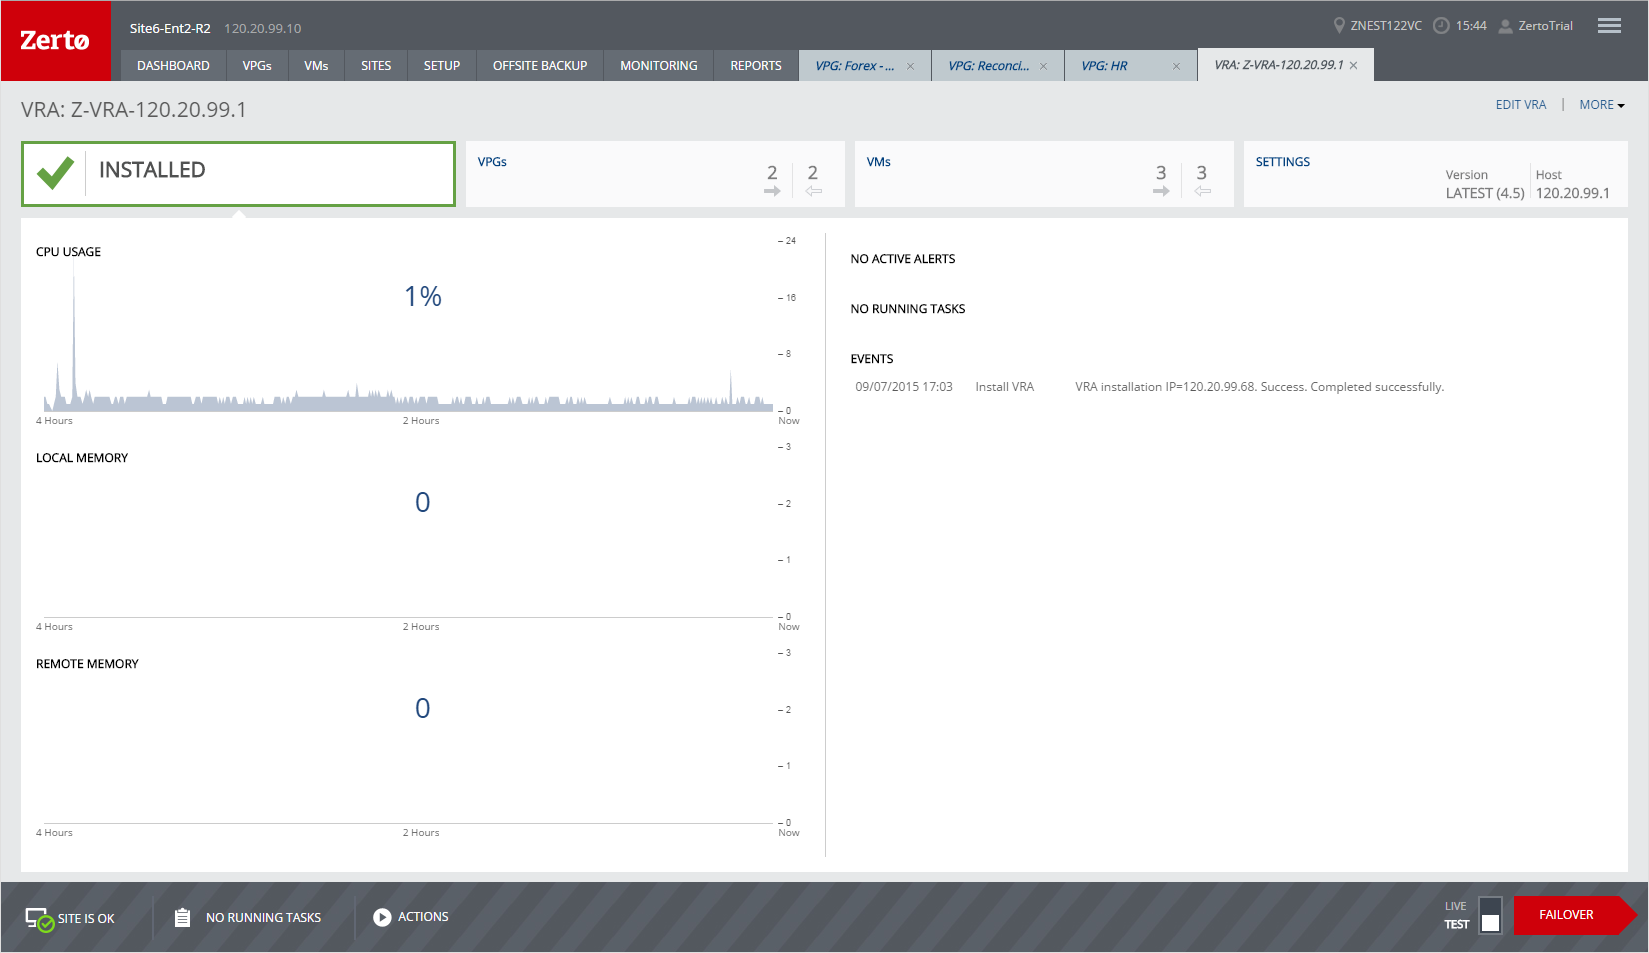
You monitor the status of a single VRA by clicking the VRA name in the VRAs tab. The VRA details are displayed in a dynamic tab.
You can filter information in columns via the filter icon next to each column title. You can also sort the list by each column.
Installed Tab
The tab on the left side shows the status of the VRA. The following information is displayed when this tab is selected:
Performance Graphs
■ CPU Usage – The percentage of CPU used by the VRA.
■ Local Memory – The percentage of the VRA memory used by protected volumes managed by the VRA. If the memory consumption is high you can consider vMotioning some of the virtual machines to a different host.
■ Remote Memory – The percentage of the VRA memory used by recovery volumes managed by the VRA. If the memory consumption is high you can consider changing the target host of some of the virtual machines to a different host.
ACTIVE ALERTS, RUNNING TASKS, and EVENTS
A listing of the currently active alerts and running tasks, and the events run during the last few hours.
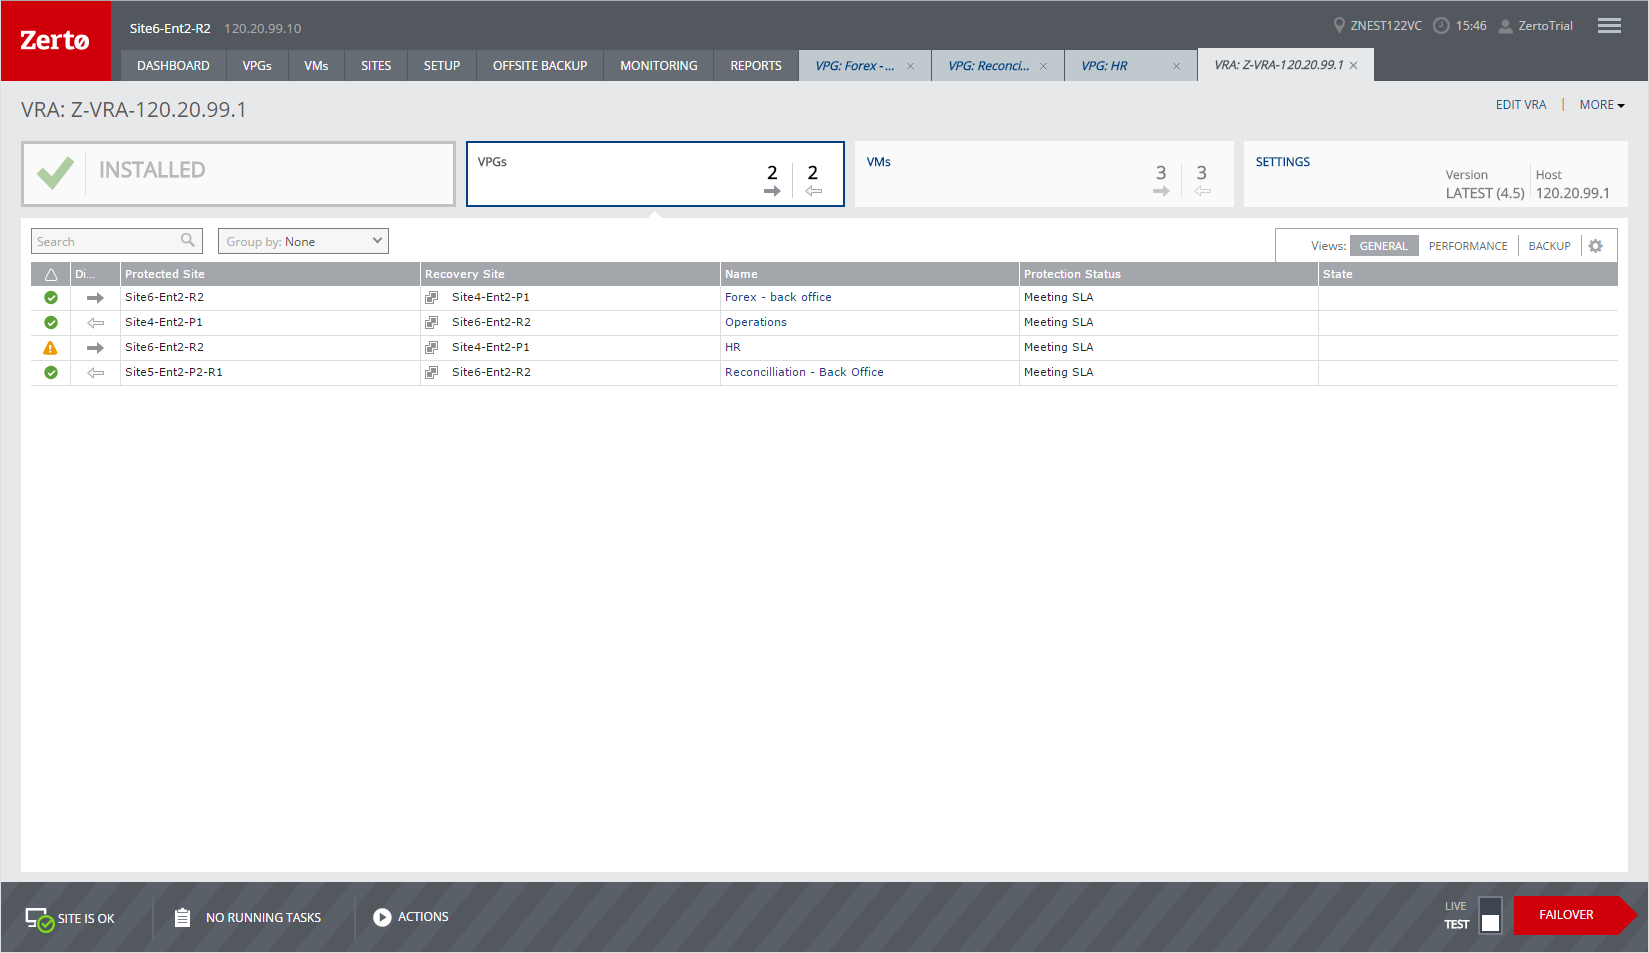
VPGs Tab
Information about the VPGs with virtual machines that are on the host with the VRA is displayed in the VPGs tab.
GENERAL View
The following information is displayed in the GENERAL view:
Alert status indicator – The color indicates the status of the VPG:
Green – The VPG is being replicated, including syncing the VPG between the sites.
Orange – The VPG is being replicated but there are problems, such as an RPO value larger than the Target RPO Alert value specified for the VPG.
Red – The VPG is not being replicated, for example, because communication with the remote site is down.
Direction – The direction of the replication, from this site to the remote site or from the remote site to this site.
Protected Site – The name of the protected site.
Recovery Site – The name of the recovery site.
Name – The name of the VPG.
Protection Status – The current status of the VPG, such as Meeting SLA. Where appropriate, the percentage of the operation completed, such as syncing, is displayed.
State – The current substatus of the VPG, such as Delta syncing. Where appropriate, the percentage of the operation completed, such as syncing, is displayed.
PERFORMANCE View
The following information is displayed in the PERFORMANCE view:
# VMs on VRA/#VMs in VPG – The number of virtual machines on the VRA and the number of virtual machines in the VPG.
Provisioned– The provisioned storage for all the virtual machines in the VPG. This value is the sum of the values that are used in the vSphere Client console per virtual machine in the Virtual Machines tab for the root vCenter Server node. Each value is the sum of both the hard disk and memory. Thus, a virtual machine with 1GB hard disk and 4GB memory will show 5GB provisioned storage.
Used – The storage used by all virtual machines in the VPG. This value is the sum of the values that are used in the vSphere Client console per virtual machine in the Virtual Machines tab for the root vCenter Server node.
IOPS – The IO per second between all the applications running on the virtual machines in the VPG and the VRA that sends a copy to the remote site for replication.
Throughput – The MB per second for all the applications running on the virtual machines being protected. There can be a high IO rate with lots of small writes resulting in a small throughput as well as a small IO with a large throughput. Thus, both the IOPS and Throughput values together provide a more accurate indication of performance.
BACKUP View
The following information is displayed in the BACKUP view:
Retention Policy – Whether the VPG is protected against a disaster only with the ability to recover to a point in time up to 14 days before the disaster, or protection is extended to include offsite backups of the virtual machines, going back for a maximum of one year.
Backup Status – The status of the backup.
Backup Repository – The name of the repository where the jobs are stored.
Restore Point Range – The restore points for the backup jobs out of the total backup jobs run for the VPG.
Backup Scheduling – The schedule for offsite backups.
Additional Fields
There is an additional field that you can display. This field is listed when you select
Show/Hide Columns from the dropdown list shown by clicking the configuration icon (

):
ZORG – A name given to an organization by a cloud service provider. For details refer to Zerto Cloud Manager Administration Guide.
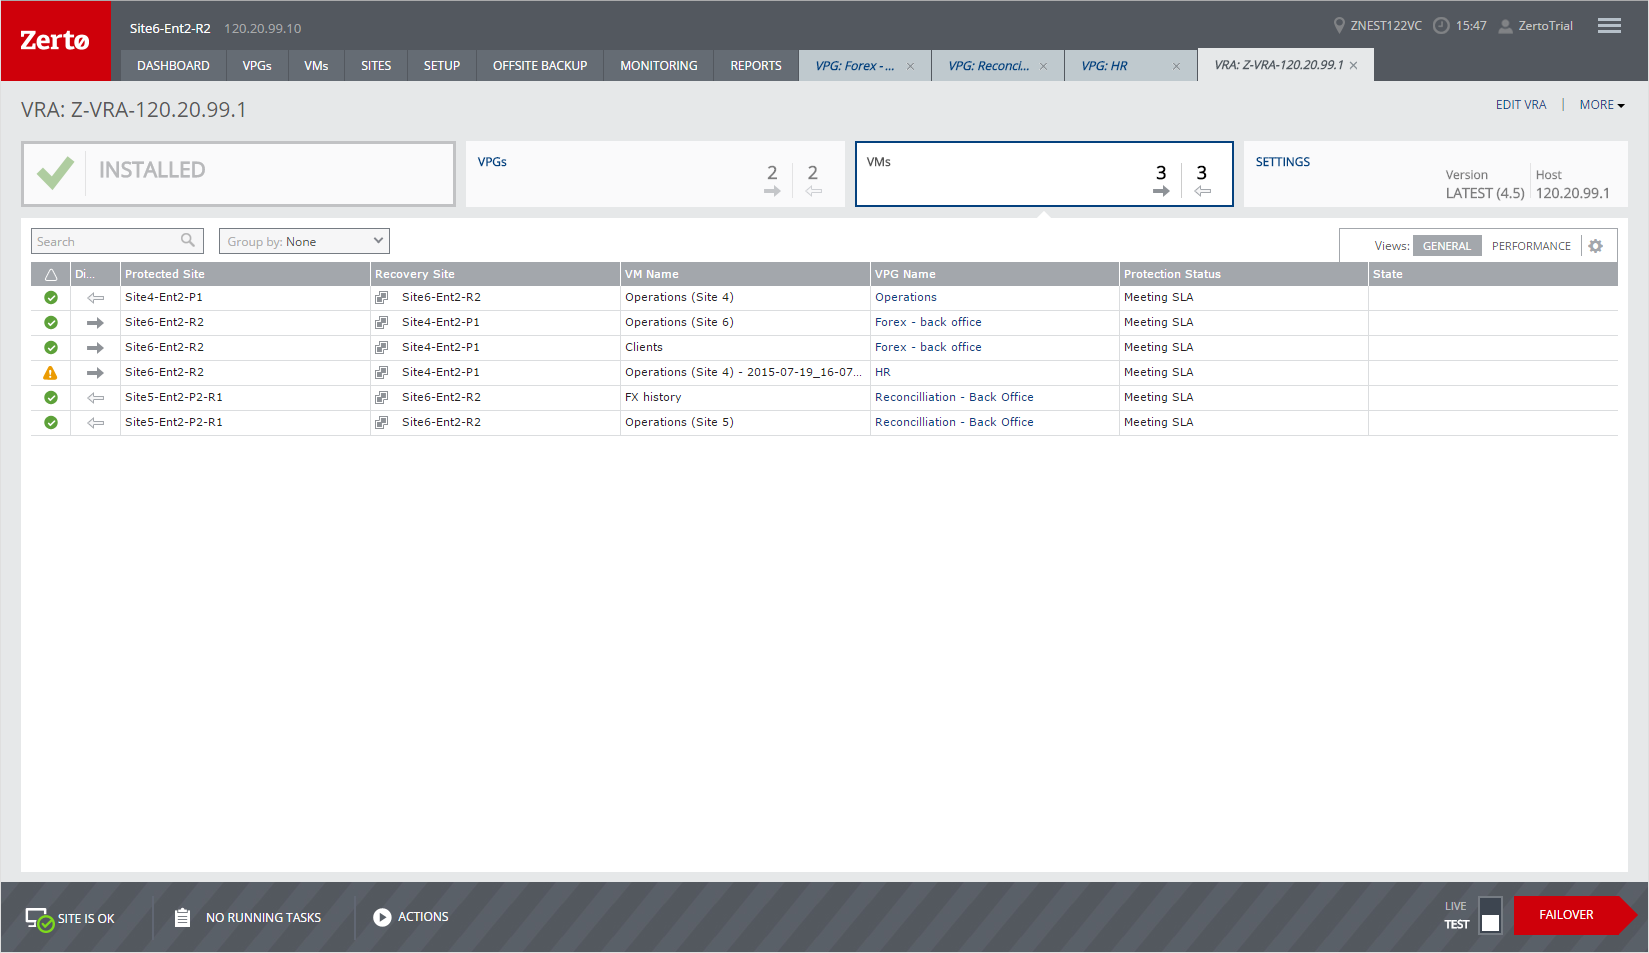
VMs Tab
Information about the virtual machines that are on the host with the VRA is displayed in the VMs tab.
GENERAL View
The following information is displayed in the GENERAL view:
Alert status indicator – The color indicates the status of the VPG:
Green – The VPG is being replicated, including syncing the VPG between the sites.
Orange – The VPG is being replicated but there are problems, such as an RPO value larger than the Target RPO Alert value specified for the VPG.
Red – The VPG is not being replicated, for example, because communication with the remote site is down.
Direction – The direction of the replication, from this site to the remote site or from the remote site to this site.
Protected Site – The name of the protected site.
Recovery Site – The name of the recovery site.
VM Name – The name of the virtual machine.
VPG Name – The name of the VPG with which this virtual machine is associated.
Protection Status – The current status of the virtual machine, such as Meeting SLA. Where appropriate, the percentage of the operation completed, such as syncing, is displayed.
State – The current substatus of the virtual machine, such as Delta syncing. Where appropriate, the percentage of the operation completed, such as syncing, is displayed.
PERFORMANCE View
The following information is displayed in the PERFORMANCE view:
Provisioned on Host – The provisioned storage for the virtual machine on the host. This value is the sum of the values that are used in the vSphere Client console for the virtual machine in the Virtual Machines tab for the root vCenter Server node. Each value is the sum of both the hard disk and memory. Thus, a virtual machine with 1GB hard disk and 4GB memory will show 5GB provisioned storage.
Used on Host – The storage used by the virtual machine in the VPG. This value is the sum of the values that are used in the vSphere Client console for the virtual machine in the Virtual Machines tab for the root vCenter Server node.
IO – The IO per second between all the applications running on the virtual machines in the VPG and the VRA that sends a copy to the remote site for replication.
Throughput – The MB per second for all the applications running on the virtual machine. There can be a high IO rate with lots of small writes resulting in a small throughput as well as a small IO with a large throughput. Thus, both the IOPS and Throughput values together provide a more accurate indication of performance.
Additional Fields
There is an additional field that you can display. This field is listed when you select
Show/Hide Columns from the dropdown list shown by clicking the configuration icon (

):
ZORG – A name given to an organization by a cloud service provider. For details refer to Zerto Cloud Manager Administration Guide.
SETTINGS Tab
Information about the VRA is displayed in the SETTINGS tab. This includes its version, the host on which it is located, its definition, the networks it uses, and its replication and recovery settings.