Collecting Zerto Virtual Replication Logs
You can collect logs using the diagnostics tool to help Zerto support resolve problems when the Zerto Virtual Manager is running or when the Zerto Virtual Manager is not running.
■ When the Zerto Virtual Manager is running, see
To collect logs for Zerto support to use when troubleshooting:. This option enables you to specify the logs that you want to collect, generated by Zerto Virtual Replication, for example VRA logs, as well as logs generated by VMware, for example, vCenter Server logs or host logs. The Zerto Virtual Replication generated logs can be filtered by any alerts issued and by the VPGs that require analysis to identify problems.
You can also collect logs for the ZertoVssAgent. For details, see
Collecting Log Information for the ZertoVssAgent.
To collect logs for Zerto support to use when troubleshooting:
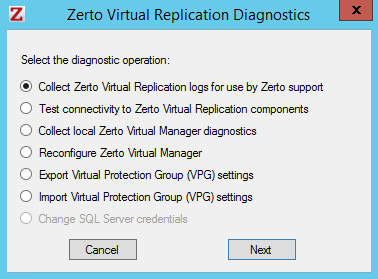
1. Open the Zerto Diagnostics application. For example, via Start > Programs > Zerto Virtual Replication > Zerto Diagnostics.
The Zerto Virtual Replication Diagnostics menu dialog is displayed.
2. Select the Collect the Zerto Virtual Replication logs for use by Zerto support option.
3. Click Next.
The Initialize dialog is displayed.
4. Specify the following and click Next.
IP / Host Name – The IP of the Zerto Virtual Manager where the log collection runs from. Logs are collected from this site and from the paired site.
Port – The port used for inbound communication with the Zerto Virtual Manager.
Your Company Name – A name to identify the log collection for the customer. This information is used by Zerto support. An account name must be entered. After this information is added, it is displayed in subsequent uses of the diagnostics utility.
Email – An email address for use by Zerto support when analyzing the logs. An email address must be entered. After this information is added, it is displayed in subsequent uses of the diagnostics utility.
Timeframe – The amount of time you want to collect logs for. The more time, the bigger the collection package.
Case Number – The case number assigned by Zerto support, if one already exists. Optional.
Description – An optional free text description of the reason for collecting the logs.
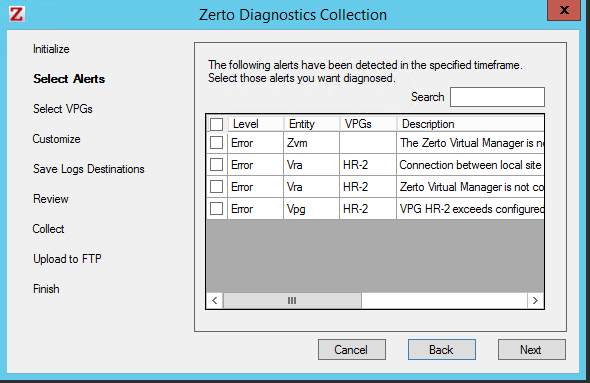
After clicking Next the utility connects to the Zerto Virtual Replication and if any alerts have been issued, they are displayed in the Select Alerts dialog.
If there are no alerts, this dialog is skipped.
5. Select any alerts that need analyzing from the list and click Next.
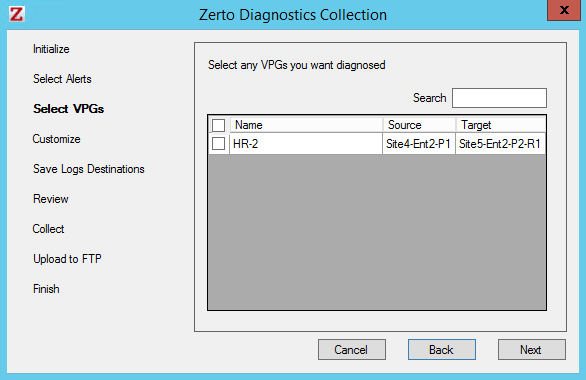
The Select VPGs dialog is displayed.
6. Select the VPGs that you want analyzed and click Next.
The Customize dialogs are displayed. These dialogs can generally be left with their default values.
The following Customize dialogs are displayed:
■ The Select Sites dialog
■ The Select VRA Hosts dialog
■ The Select vSphere Logs dialog
■ The Select vCloud Director Logs dialog
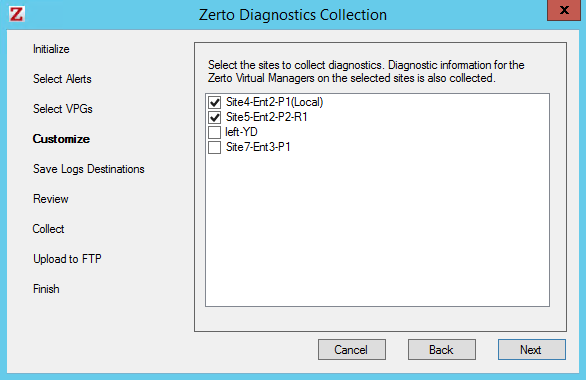
The Select Sites dialog is displayed, with the list local site and all the sites paired to it listed.
Those sites that are either protecting or used for recovery for any of the selected VPGs from the previous dialog are automatically selected.
Note: Zerto Virtual Manager logs from both sites are collected when both sites are trusted sites otherwise only logs from the local site are collected.
7. Verify that the sites that need analyzing are selected and click Next.
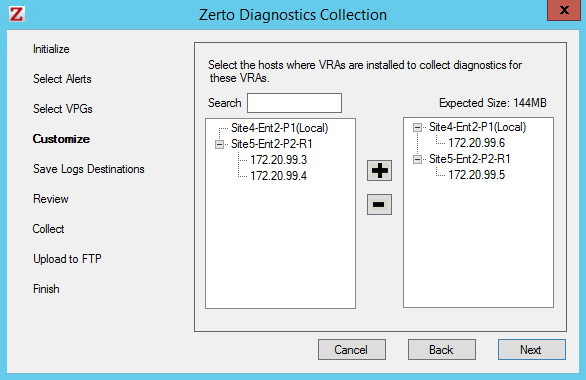
The Select VRA Hosts dialog is displayed.
Those hosts with VRAs that are used to protect or recover any of the selected VPGs are automatically selected.
You can change the collection criteria using the plus and minus buttons. The expected size of the collection package is updated dependent on the selected VRAs.
8. Verify that the host with VRAs that need analyzing are selected and click Next.
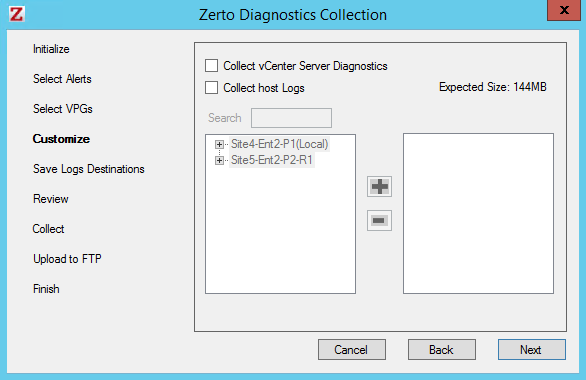
The Select vCenter Server Logs dialog is displayed.
Specify the vSphere data to collect.
Collect vCenter Server Diagnostics – Collects vCenter Server diagnostics.
Collect Host Logs – Collects logs generated for hosts. If you check the Collect host logs checkbox, you can select the host logs to be included in the collection by using the plus and minus buttons.
The vSphere data that can be collected enlarges the size of the log collection package significantly and is not collected by default.
9. Click Next.
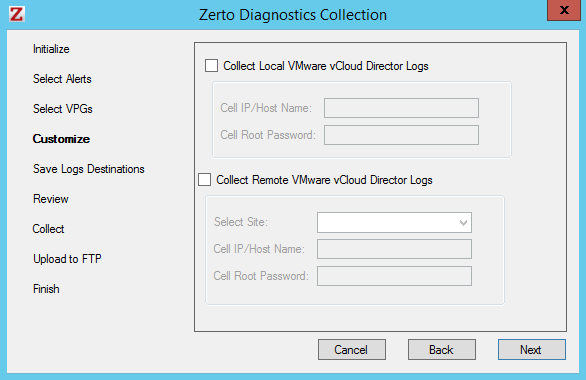
The Select vCloud Director Logs dialog is displayed.
10. Click Next.
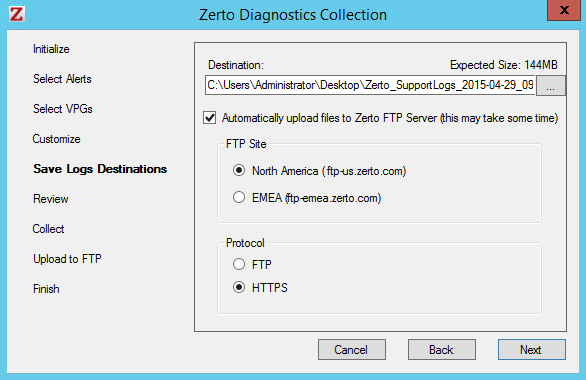
The Save Log Destinations dialog is displayed.
11. Specify destination for the files that you want collected.
Destination – The name and location where the log collection will be saved.
Automatically upload files to Zerto FTP Server – When this option is checked, the log collection is automatically uploaded to a specified FTP site.
If you choose to upload the log collection to a site that you specify, make sure that the site is up.
12. Specify the FTP site to send the collection and the protocol to use, either FTP or HTTP.
13. Click Next.
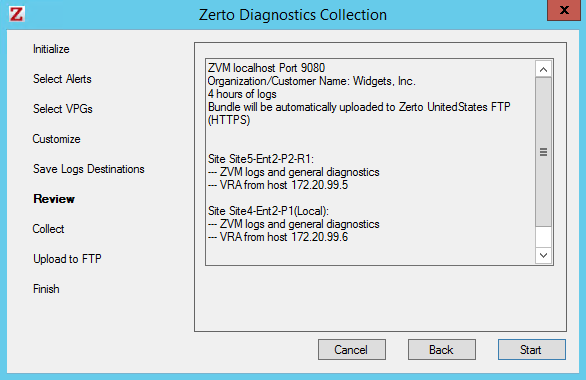
The Review dialog is displayed.
Check that you have specified everything you want to collect and if you want to make changes, click Back to change the selection.
14. Click Start.
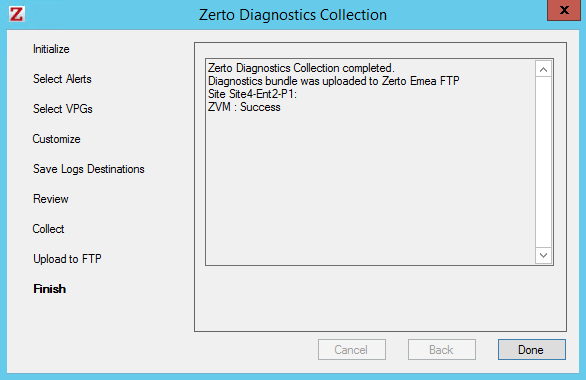
The data is collected and stored in the destination file which, by default, is timestamped. If specified, the collection is also sent to an FTP site.
Note: The log collection is performed on the server. Canceling the collection in the GUI does not stop the collection from continuing on the server and a new log collection cannot be run until the running collection finishes.
When the log collection has completed the result is displayed. For example:
15. Click Done to return to the Zerto Virtual Replication Diagnostics menu dialog.
16. Send the log to Zerto support, unless the Automatically upload files to Zerto FTP Server option was specified, in which case it is automatically sent to Zerto.
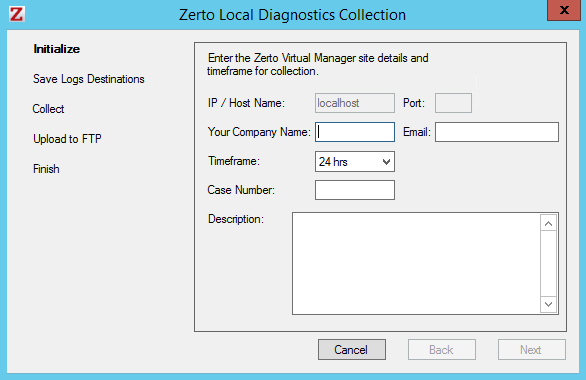
To collect local Zerto Virtual Manager logs when the Zerto Virtual Manager is not running:
1. Open the Zerto Diagnostics application. For example, via Start > Programs > Zerto Virtual Replication > Zerto Diagnostics.
The Zerto Virtual Replication Diagnostics menu dialog is displayed.
2. Select the Local Zerto Virtual Manager diagnostics option and click Next.
You are prompted to use the first option to collect more comprehensive diagnostics. If you continue, the Initialize dialog is displayed.
3. Specify the details that you want collected.
IP / Host Name – The IP of the Zerto Virtual Manager where the log collection runs from. Logs are collected from this site and from the paired site.
Port – The port used for inbound communication with the Zerto Virtual Manager.
Your Company Name – A name to identify the log collection for the customer account. This information is used by Zerto support. An account name must be entered.
Email – An email address for use by Zerto support when analyzing the logs. An email address must be entered.
Timeframe – The amount of time you want to collect logs for. The more time, the bigger the collection package.
Case Number – An optional field for the case number assigned to the issue by Zerto.
Description – An optional free text description of the reason for collecting the logs.
4. Click Next.
The Save Log Destinations dialog is displayed.
5. Specify the details that you want collected.
Destination – The name and location where the log collection will be saved.
Automatically upload files to Zerto FTP Server – When this option is checked, the log collection is automatically uploaded to a specified FTP site.
If you choose to upload the log collection to a site that you specify, make sure that the site is up before clicking Finish.
The data is collected and stored in the destination file which, by default, is timestamped. If specified, the collection is also sent to an FTP site.
6. Click Next.
The collection progress is displayed. When the log collection has completed the result is displayed.
7. Click Done to return to the Zerto Virtual Replication Diagnostics menu dialog.
8. Send the log to Zerto support, unless the Automatically upload files to Zerto FTP Server option was specified, in which case it is automatically sent to Zerto.