
Page 3 - URMD-15-16-AnnualReport
P. 3
URMD FY 2015-2016 Annual Report
PAVEMENT CONDITIONS ANNUAL ROAD MAINTENANCE STRATEGY URMD BOUNDARY MAP
Maintaining URMD streets MAINTENANCE PROGRAM
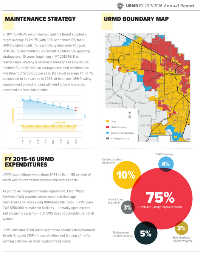
Since 1994, the URMD average URMD roads are routinely inspected and In 2011, URMDAC recommended and the Board adopted a
Pavement Condition Index (PCI) has scheduled for cost-effective and timely target average PCI of 75 (with 90% at or above 65) for all
improved significantly, from 60 (with 23 preventive maintenance. Annually, about 25 URMD-eligible roads. To reach this system-wide PCI goal,
percent of roads rated in poor or very poor condition), to 81.7 percent of all URMD pavement surfaces are inspected URMDAC recommended a consistent maintenance spending
(with less than 1 percent in poor or very condition). A PCI of 100 and rated by an outside contractor. Planned preventive strategy over 10 years, beginning in FY 2013-14. This
represents a new road. maintenance activities are included in Washington County’s maintenance strategy is reviewed annually and adjusted as
annual Road Maintenance Program. Public comment on the needed. Currently, with an average pavement maintenance
URMD MILES BY PAVEMENT CONDITION program is solicited prior to its adoption by the Board investment of $750,000 per year, the target average PCI of 75
Total Miles 450 of Commissioners. is expected to be reached in 2023. At that time, URMD safety
Total Miles Total Miles Total Miles 446.2 improvement project funding will need to be allocated to
434.4 439.4 440.8 400 pavement surface maintenance.
350 For efficiency purposes, URMD road surface maintenance
AVG PCI AVG PCI AVG PCI AVG PCI treatments alternate each year between slurry seal and overlay 81 81
82.9 82.4 82.5 81.7 300 treatments. FY 2015-16 was the last year the County used 80 79
250 MILES micro-surface treatments on URMD roads. 78 77 76 75
200 N
150 25 EXPENDITURE PCI
100 $750,000 Cities
20
50 URMD Boundary
0 MILES TREATED 15 Urban Growth Boundary
Washington County
2013 2014 2015 2016 10 2016 2017 2018 2019 2020 2021 2022 2023
5
196 186 176 146 Very Good CWS Drainage
0 FY 2015-16 URMD
216 227 241 274 Good 2014-15 2015-16 2016-17 2017-18 Contract surface
0.0 4.0 0.0 0.0 Micro-Surface EXPENDITURES treatments 4%
20 23 22 24 Fair 15.6 0.0 21.6 0.0 Slurry Seal 10%
1.9
4.4
0.0
3.0
Overlay
2 3 2 2 Poor URMD expenditures were about $4.14 million – 88 percent of
which was for contracted services and related costs.
0 0 0 0 Very Poor DID YOU In FY 2015-2016 URMD served over
25,000 acres of land, 66,000 tax lots
KNOW? and a population of over 200,000. As part of an intergovernmental agreement, Clean Water
Services (CWS) provides storm water and drainage 75%
maintenance services along URMD-eligible roads. URMD pays Contract prep
and admin
URMD STREETS TODAY NON-URMD ROADS CWS $150,000 to maintain facilities – primarily open ditches 3% Contract Safety Improvements
Success on the streets and old piping systems – that CWS does not consider part of its
Functional Classification Centerline Miles Target PCI 2016 Avg PCI
system.
Urban Arterial 131 80 75
URMD ROADS
Urban Collector 73 75 74 3%
Functional Classification Centerline Miles Target PCI 2016 Avg PCI Rural Arterial 73 80 75 URMD allocates $250,000 a year to the county’s Neighborhood Maintenance 5%
Neighborhood Routes 84 75* 81 Rural Collector 169 75 79 Streets Program (NSP) for coordination and funding of traffic- service requests Neighborhood
Urban Local 362 75* 81 Rural Local 176 65 68 calming activities on local neighborhood roads. Streets Program
* Per URMD Intergovernmental Agreement (BCC16-127)
www.WashCoURMD.com