 |
OpenStudioCore:resultsviewer |
|
OpenStudioCore:resultsviewer |
ResultsViewer was created by the National Renewable Energy Laboratory (NREL) for the U.S. Department of Energy. NREL researchers, who frequently use detailed EnergyPlus outputs, originally developed this application to make it easier to understand the complex intricacies of building systems.
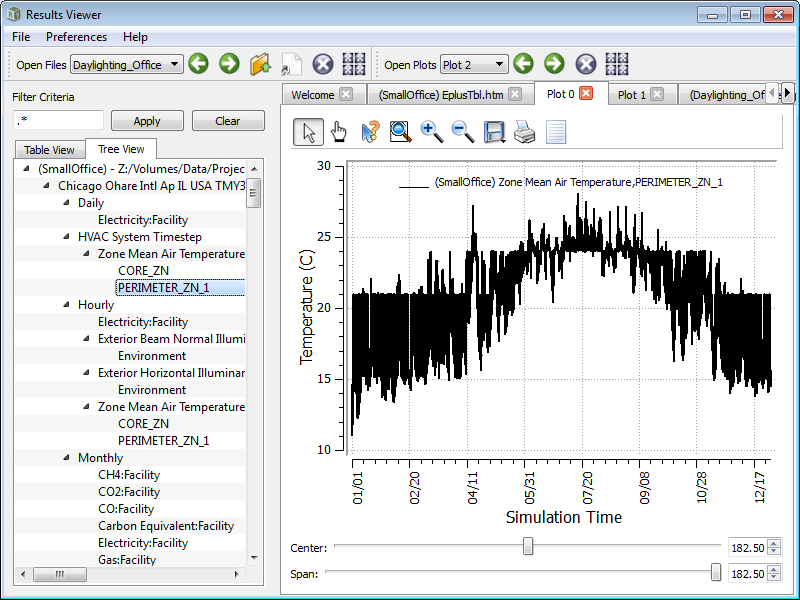
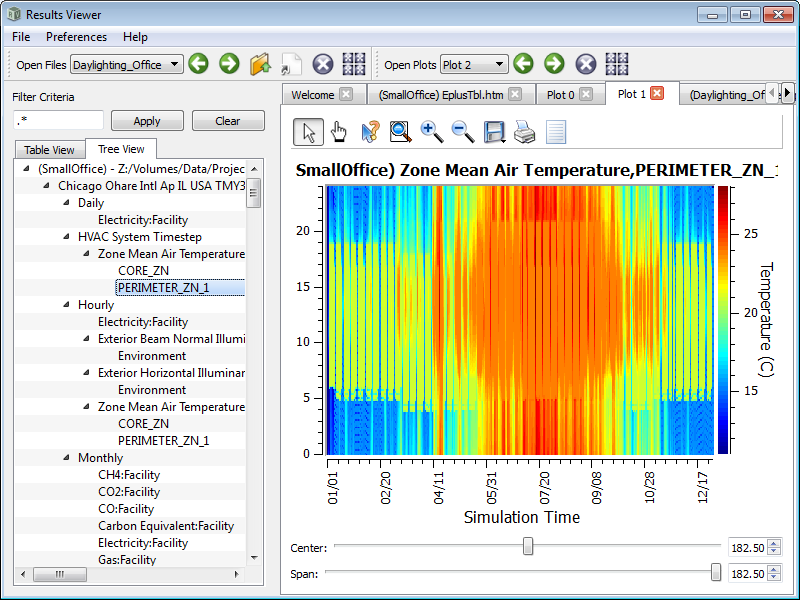
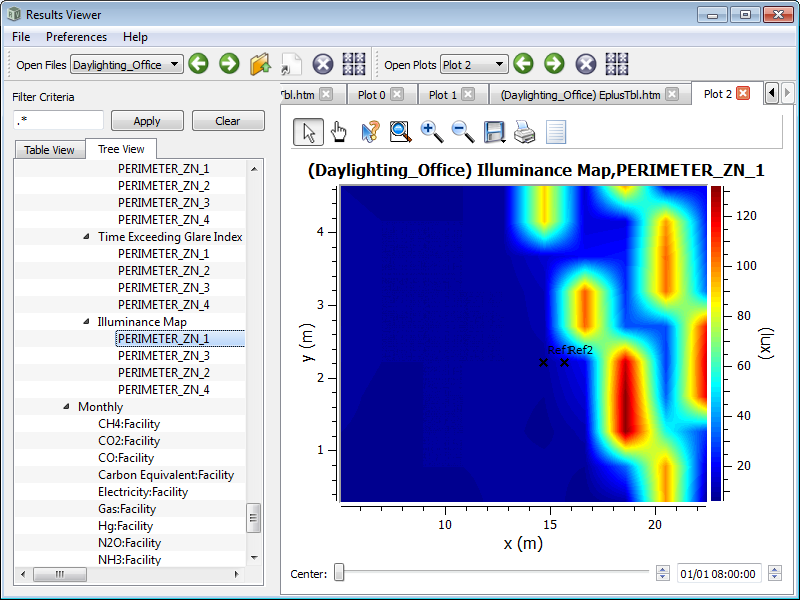
This beta release of ResultsViewer presents time series and illuminance map results, which are the product of EnergyPlus report variable requests. ResultsViewer reads the SQLite database output of EnergyPlus and displays the data in the form of line plots and two dimensional flood plots and illuminance maps. You can chart EnergyPlus report variables and meters down to the detailed time step. Illuminance maps are shown at hourly timesteps with reference points. ResultsViewer also displays the EnergyPlus summary report in an internal browser window. More features and capabilities will be added to ResultsViewer in the future.