Variables in a Science Experiment
Cause and Effect Relationships Among Variables
A change in the manipulated/independent variable will cause a change in the responding/dependent variable.
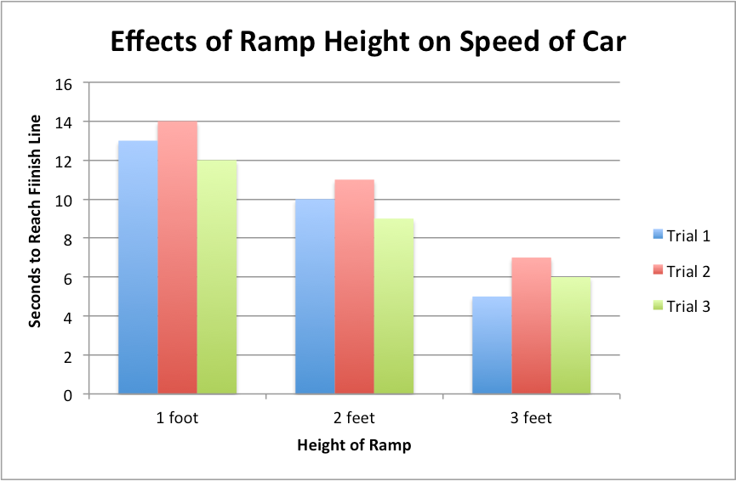
For Example: Changing height of a ramp will cause a K'nex car to go faster or slower.
Manipulated/Independent Variable = Height of the Ramp
Responding/Dependent Varialbe = Seconds to Reach the Finish Line
K'nex Cars on a Ramp
Another Example
True or False
According to the graphs, the Catawba River has less chemical pollutants and more organisms than Young’s Creek. This means that chemical pollution in Young’s Creek may have caused a reduction of organisms in that body of water.
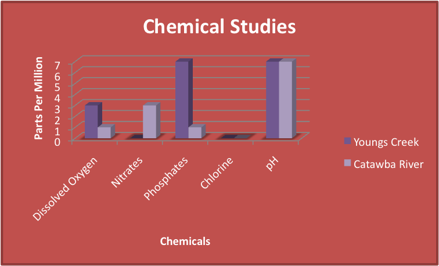
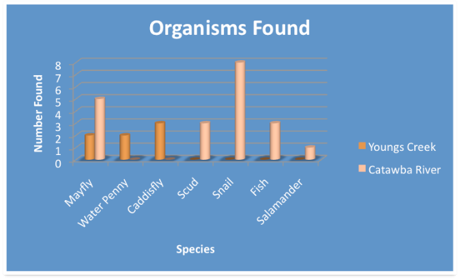
This is True.
Patterns of Change
Patterns of change (trends) can be used to make predictions. For Example: A decrease in seagrass over many years will likely lead to more coastal erosion
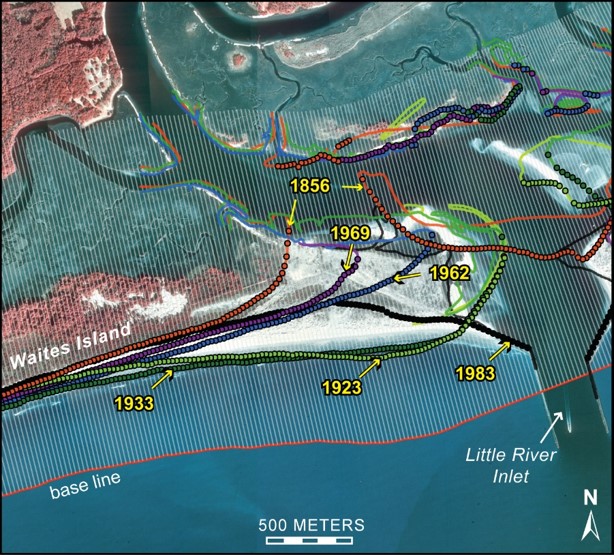 http://pubs.usgs.gov/of/2008/1206/html/figs/fig4_1.html
Let's Practice
As a K’nex carries an increased load, it will need an increase in the amount of force needed to make the car move. Looking at the graph what can you predict about the number of washers needed to move a car that is carrying 3 blocks? It will need _____ washers.
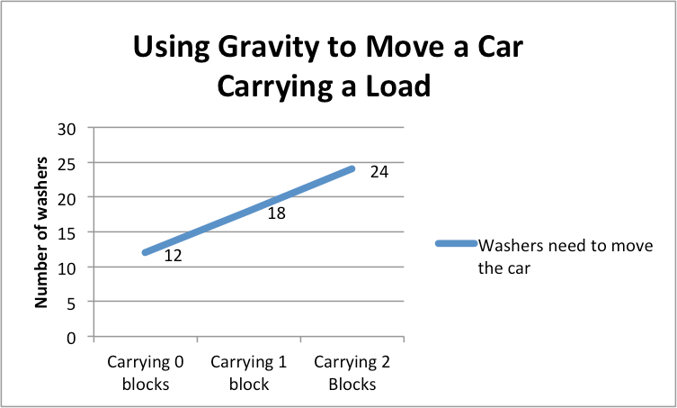
Did you pick 30 wahers? Good!
![]()
PREVIOUS
Click the arrow to go back to Control Variables.

HOME
This wil take you to the beginning of this Variables Website.

BACK TO EDET 703
This will take you back to my EDET 703 page in my Portfolio Project.
![]()
NEXT
Now that you have explore variables, you are ready for Relationships Among Variables.