Unsupervised Algorithms in Driverless AI (Experimental)
With version 1.10, Driverless AI exposes unsupervised transformers that can be used for unsupervised model building, namely:
Conceptually, the overall pipeline of an unsupervised experiment is similar to the pipeline of a regular supervised experiment, with a few notable differences:
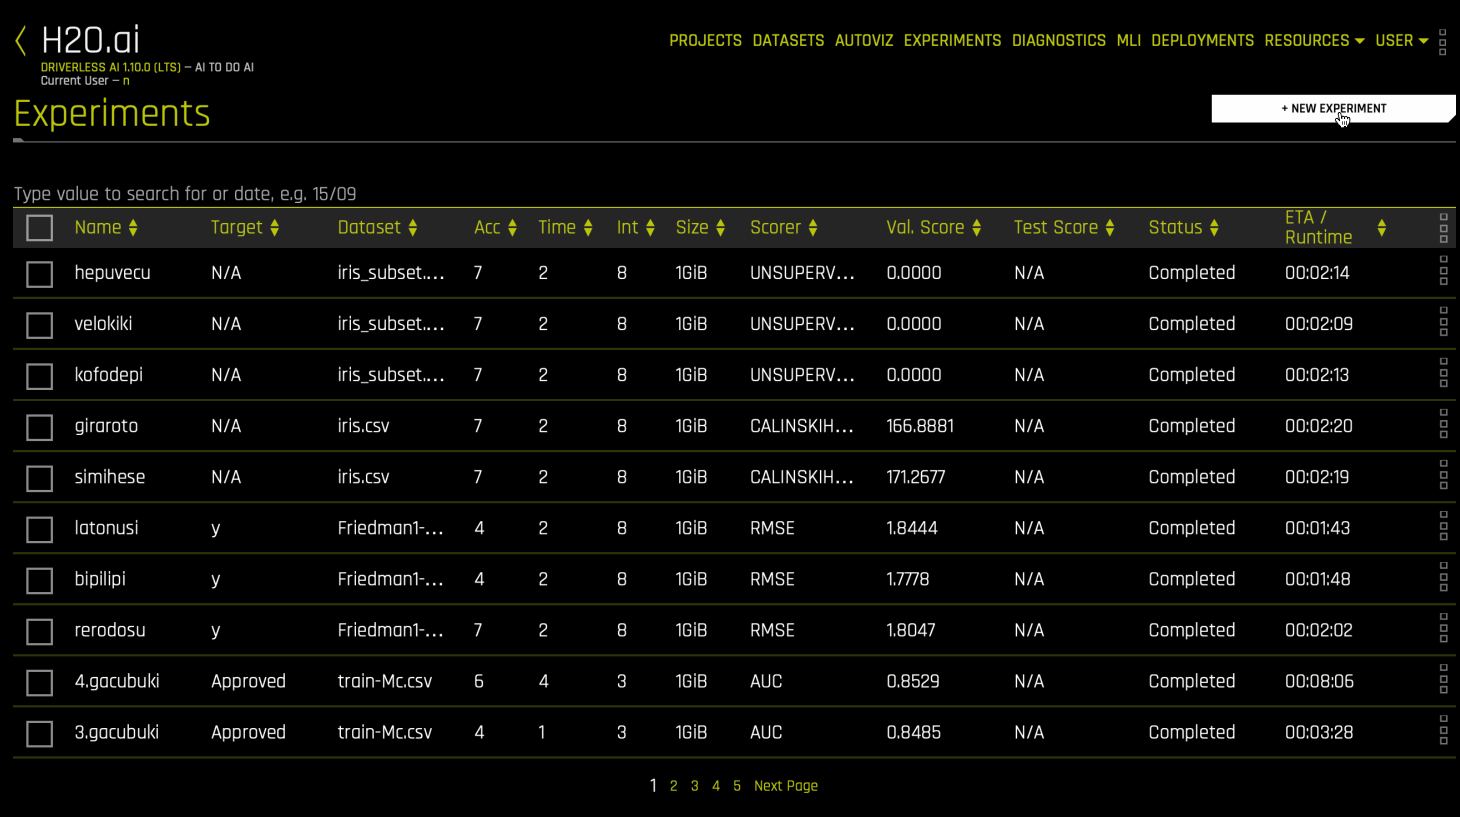
Only one unsupervised algorithm (model, pipeline) can be chosen (e.g., either Clustering or Anomaly detection, but not both). In other words, all individuals in the genetic algorithm are of the same model type, but they can have different parameters (e.g., number of clusters, columns used for clustering).
Each such unsupervised modeling pipeline consists of exactly one pretransformer, one transformer and one model. No labels (y) are required.
The unsupervised model has only one function: To list the included pretransformer, the included transformer and any applicable scorers. The model itself is a pure pass-through function, the models.predict() method returns the output of the transformer pipeline (any features the transformers makes). This also means that the variable importance of the model is ill-defined, and uniformly spread across features. For clustering, there will be only 1 feature (the assigned cluster label), and it will have variable importance of 1.0.
Automatic Machine Learning is only possible if there’s a metric (scorer) that assesses the quality of the transformation via score(X, actual=None, predicted=transformed_X). For example, the quality of the labels created by a K-Means clustering algorithm can be evaluated for a given dataset, given labels, and a metric. If no scorer is applicable, an UNSUPERVISEDSCORER is used, which returns 0 for any input. This value can be ignored, and signals Driverless AI that the experiment is converged after the first iteration.
No MLI support in 1.10.0, but is planned for future releases.
No ensembles and cross-validation for final models for unsupervised experiments (
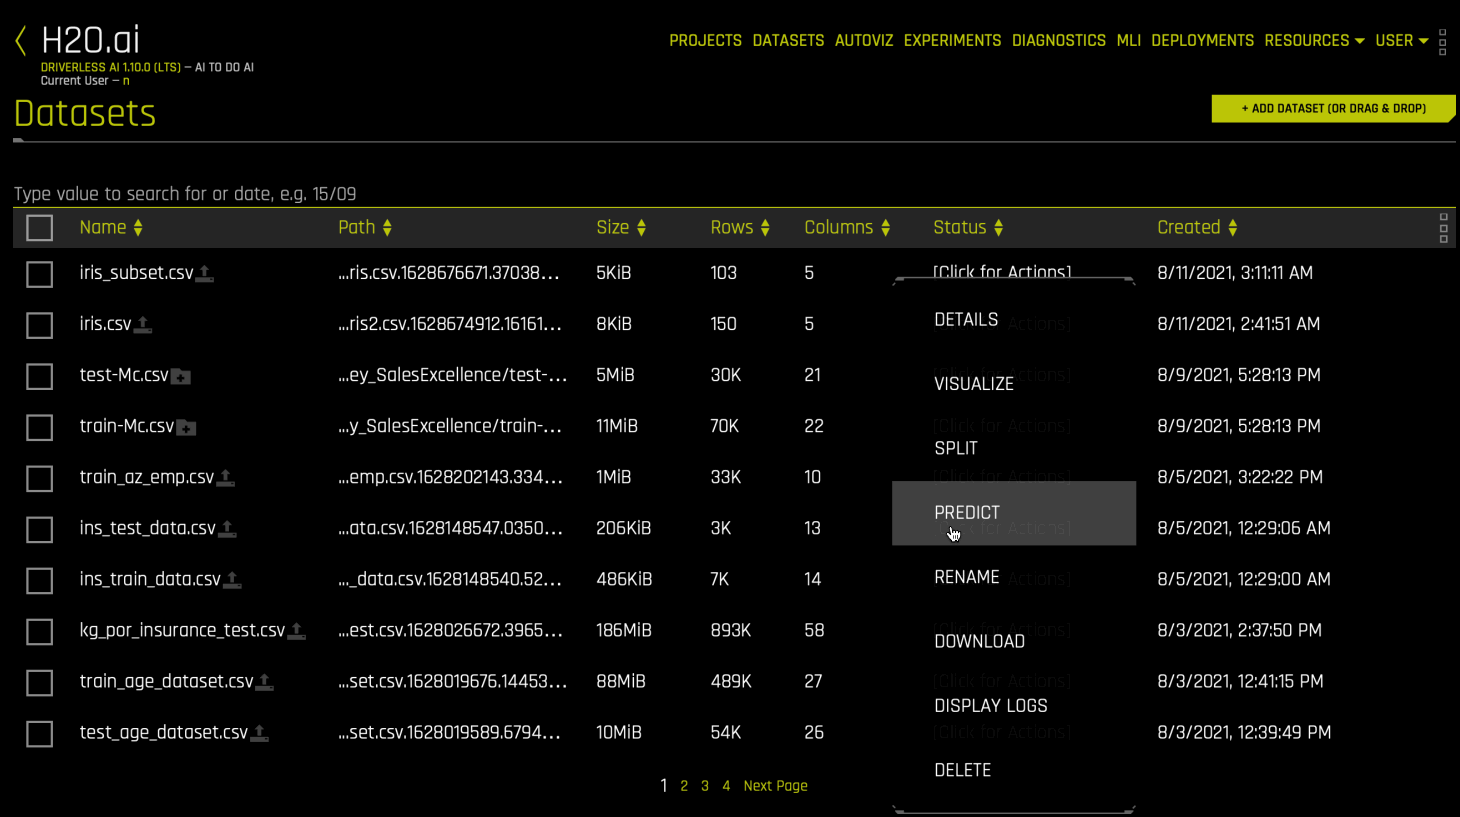
fixed_ensemble_level=0is enforced). As a consequence, creation of training holdout predictions is not possible (all data is used for the final model). If predictions like cluster assignments are desired for the training data, please make predictions on the training data, with the usual caveats of overfitting (due to heavy tuning during AutoML) since fit() and predict() are performed with the same data.
Isolation Forest Anomaly detection
Isolation forest isolates or identifies the anomalous entries by randomly splitting the decision trees. The idea is that an outlier will lie farther away from the regular observations in the feature space and hence will require fewer random splits to isolate to the terminal node of a tree. The algorithm assigns an anomaly score to each observation based on its path length (from root node to terminal node) in the forest. The lower the score, the more likely it is that the row is an anomaly. Internally, Driverless AI runs sklearn’s Isolation Forest implementation.
When building a model, the Accuracy and Time knobs of Driverless AI can be toggled to adjust the effort spent on model tuning but presently as there is no scorer being used for isolation forest, when doing genetic algorithm, the model will converge immediately and use one of the models from the tuning phase as the final model. The Interpretability knob is ignored in the default set up. The number of trees or n_estimators for the isolation forest model can be adjusted with the isolation_forest_nestimators expert setting parameter.
After building the model, the scores can be obtained by predicting on the same dataset. The lower the scores of a row, the more likely it is an outlier or anomaly by the model. The Visualize Scoring Pipeline option summarizes the features used and transformations applied in building the model.
To create labels from these scores, quantile value can be used as a threshold. For example, if you know that 5% of the rows are anomalous in your dataset, then this can be used to calculate the 95th quantile of the scores. This quantile can act as a threshold to classify each row as being an anomaly or not.
The Python scoring pipeline can be used to deploy the Isolation Forest model to production (currently no MOJO support).
Use case idea: Given an anomaly detection experiment, you can create predictions on the training dataset, including all original columns, and re-upload into Driverless AI to run a supervised experiment. For a given similar dataset (in production), you now have an unsupervised scorer that tells you the anomaly score for each row, and supervised scorer which makes Shapley per-feature contribution reason codes to explain why each row is an anomaly or not.
KMeans Clustering
Clustering algorithms partition observations into clusters. Driverless AI uses sklearn KMeans clustering algorithm to partition the observations so that they belong to the cluster with the nearest mean (centroid of the cluster).
Driverless AI exposes the following unsupervised models that run on numeric and categorical columns to build a K-Means clustering model. You can either pick a model type based on the characteristics of your dataset, or run all of them (one by one) to decide which one works best for your dataset.
KMeans : This does K-Means clustering only on numeric columns
KMeansFreq : This does K-Means clustering on numeric and frequency transformed categorical (integer columns are treated only as numeric)
KMeansOHE : This does K-Means clustering on numeric and one-hot-encoding transformed categorical columns
Driverless provides the following scorers to enable automatic unsupervised clustering:
CALINSKI HARABASZ : The Calinski-Harabasz index also known as the Variance Ratio Criterion, is the ratio of the sum of between-clusters dispersion and of inter-cluster dispersion for all clusters. The higher this score , the better the performances.
DAVIES BOULDIN : The Davies-Bouldin Index signifies the average ‘similarity’ between clusters, where similarity is a measure that compares distance between clusters with the size of the clusters themselves. A lower Davies-Bouldin index relates to a model with better separation between the clusters.
SILHOUETTE : The Silhouette Coefficient is defined for each sample and is composed of two scores. The mean distance between a sample and all other points in the same class. This score measure the closeness of points in the same cluster. And the mean distance between a sample and all other points in the next nearest cluster. This score measure the distance of points of different clusters. A higher Silhouette Coefficient score relates to a model with better defined clusters. This scorer can be slow for larger datasets. Ref
While building a clustering model, Accuracy and Time knobs can be toggled to adjust the effort spent on model tuning and validation. The Interpretability knob is ignored for the currently supported unsupervised models out of the box, but custom recipes can be written to listen to interpretabilty settings to control say parameter mutations during model building. The unsupervised_clustering_min_clusters and unsupervised_clustering_max_clusters parameters can be used in the expert panel to set the upper and lower bound on the number of clusters to build.
During model building, Driverless AI creates KMeans Clustering model on a subset of features (between 2 to 5). The feature subset size, columns to be used for clustering and the parameter tuning is decided during the genetic algorithm process. User can set the feature subset size (dimensionality of space to cluster) by fixed_interaction_depth parameter of the expert settings. The value should lie between 2 to 5. Say, fixed_interaction_depth=4, then clustering will be performed in 4D. If say, more than 4 features are present in the dataset (or after accounting for the pre-transformations like one-hot-encoding), then when doing genetic algorithm, DAI will select input features and model parameters (based on internal train/valid split(s)) to decide the best possible subset of 4 features and their parameter set to build the model that optimizes the scores.
The scorer takes the full dataset (pre transformed with all features) and labels for the rows as created by the (subset of features) clustering model to give the scores. It compares the output of the unsupervised transformer to its input.
The Insights tab of the experiment gives a peek into the working of clustering transformer on the subset of features to build the best model. It lists the cluster sizes and centroids for the features in the cluster. The plot displays the cluster separation in 2 dimensions and is color coded for easy visualization. Aggregator algorithm is used to reduce the datasize for the plot. This is a preview of the custom visualization capability (using Vega) that is coming soon to DAI.
After building the model, the Visualize Scoring Pipeline option can be used to inspect the pre transformations applied to the features, before building model (on subset of features) and scoring (on full set). It can also be used to inspect the features used to build the clustering model. The cluster labels can be created by predicting on the dataset.
To get cluster label assignments for the training (or any) dataset, then the fitted model can be used to make predictions, just like any supervised model. Note that overfitting can occur anytime when fit and predict are performed on the same dataset.
The clustering model produces MOJOs and Python scoring pipelines to deploy to production.

You can also write custom clustering recipes by defining your own pretransformer (i.e what columns with what encodings are fed in for clustering), clustering transformer, and scorer. To view an example, see the KMeans Clustering Using RAPIDS.ai recipe in the official Driverless AI recipes repository. (For best results, use the release branch that corresponds with your version of Driverless AI.)
Truncated SVD (Dimensionality Reduction)
Truncated SVD is a dimensionality reduction method and can be applied to a dataset to reduce the number of features before running say a supervised algorithm. It factorizes data matrix where the number of columns is equal to the specified truncation. It is useful in use cases where sparse data gets generated like recommender systems or in text processing like tfidf. Internally Driverless AI runs sklearn Truncated SVD implementation.
Driverless AI exposes the TRUNCSVD transformer to reduce the number of features. Presently, none of the parameters can be toggled by the user. The n_components created by the TRUNCSVD transformer range between 1 and 5. (Note that these are considered random mutations.) After building the model, Visualizing scoring pipeline can be used to inspect the number of components created. Additionally, the dimensionality reduced dataset can be obtained by predicting on the dataset. Presently as there is no scorer being used for SVD experiment, when doing genetic algorithm, the model will converge immediately and use one of the models from the tuning phase as the final model.
The Dimensionality Reduction model produces MOJOs and Python scoring pipelines to deploy to production.
Unsupervised Custom Recipes
Driverless AI supports custom Python recipes for unsupervised learning. You can write custom unsupervised recipes by defining your own pretransformer, transformer, and scorer. To view examples, see the official Driverless AI recipes repository. (For best results, use the release branch that corresponds with your version of Driverless AI.)