Adaptronic Logviewer

- Features
- The Main Workspace
- The Flag Display Tab
- The Channel and Flag Selection Screens
- Keyboard Shortcuts
Features:
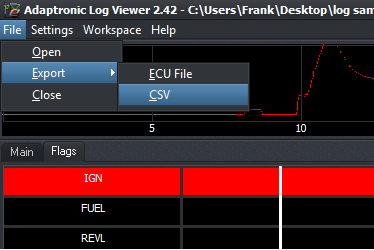
- The Adaptronic log viewer is cable of displaying files created with Eugene (ALG files), WARI (CSV files), and SEKUKU (CSV files).
- ALG files contain all the information available to the user, except ones made with internal logging for space saving reasons.
- The log viewer graphs in a time-based manner instead of a "log based" manner., meaning even if there is a discrepancy in the interval of logging (which is the case since logging is dependent on clock cycles instead of a fixed time interval), the graphing is still accurate vs. time.
- ALG files also contains the ECU information when the log was taken. This makes diagnosis a lot easier for you or us.
- CSV extraction is useful if you want to view the file usng spreadsheet software of other log viewers available.
- Because if the endless possibilities of the number channels that can be displayed with CSV files, there is no default channel setting. The channels window will automatically appear the first time you open a CSV file.
- With Modular ECUs, flags are saved as well, and you can view these with the log viewer, again making diagnosis easier.
| Modular ALG (Recorded with Eugene) | Select ALG File (Recorded with Eugene) | CSV File (Recorded with WARI or converted) | |
| Unit Conversion | YES | YES | NO |
| Flags | YES | NO | NO |
| Display Target Channel | YES | YES | NO |
| Conversion to CSV | YES* | YES* | N/A |
| Custom Range | YES | YES | YES |
*Unlike Eugene, only
channels flagged as favorites will be written into the CSV of
the same filename, located in the same folder.
The Main Workspace:
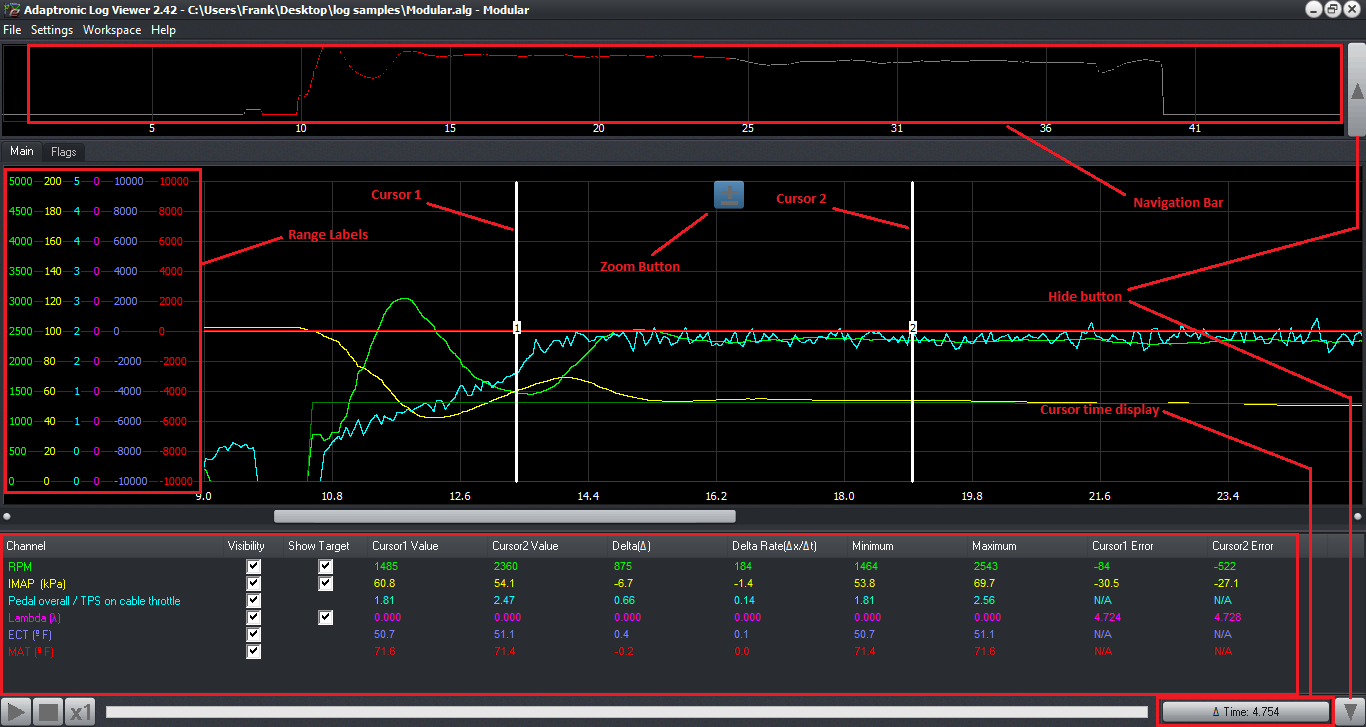
- Navigation - Drag the mouse with the left button over the navigation bar to select the area to display on the main window. Navigation parameter can be changed in the channels window. Zoom in/out by pressing PageUp/Dwn or clicking the Zoom Button, visible if the mouse hovers in the area between the two cursors. Navigate left or right using the left/right arrow keys or drag the scroll bar below the graphing area.
- View - You can hide/show the Navigation bar and Bottom Panel by clicking the shown buttons or pressing the up or down arrow key. You can also drag the bottom panel upwards or downwards by pointing in the area below the scrollbar.
- Range labels - You can approximate the actual value with these labels. There are 10 "steps", with interval of maximum (denoted) minus minimum over 10. You can customize the minimum and maximum using the Channels window.
- Cursors -There are two cursors, Cursor 1 is positioned with a left click on the workspace, Cursor 2 with a right click. Actual graph values are displayed at the table located at the bottom of the screen. Each column is described below in the next section.
- Time Display/Button - Can either show the time difference of the position of both cursors or the exact time the selected cursor is pointed to. Simply left click to change mode. (Note: Each vertical "line" in the graph may be representative of a time range. Thus the displayed value is the average value of all the logs made in that range)
- Bottom Panel - Contains a table that displays numerical values based on the positions of the two cursors and controls which channel and it's target (if applicable) is visible. Clicking on a row description (parameter name) will display the Channels window wuth that parameter selected.
- Cursor 1/2 Value - Displays the scaled value of each parameter in the current position of the cursor.
- Delta - The difference of the values of each parameter (ie. how much it has changed from cursor 1 to 2).
- Delta Rate - The rate divided by the time elapsed between cursors.
- Minimum - The minimum value in the area between cursors.
- Maximum - The maximum value in the area between cursors.
- Cursor 1/2 error - Only applicable in channels with targets. Shows the difference between a parameter and it's target value. (ie. Closed loop)
The Flag Display Tab
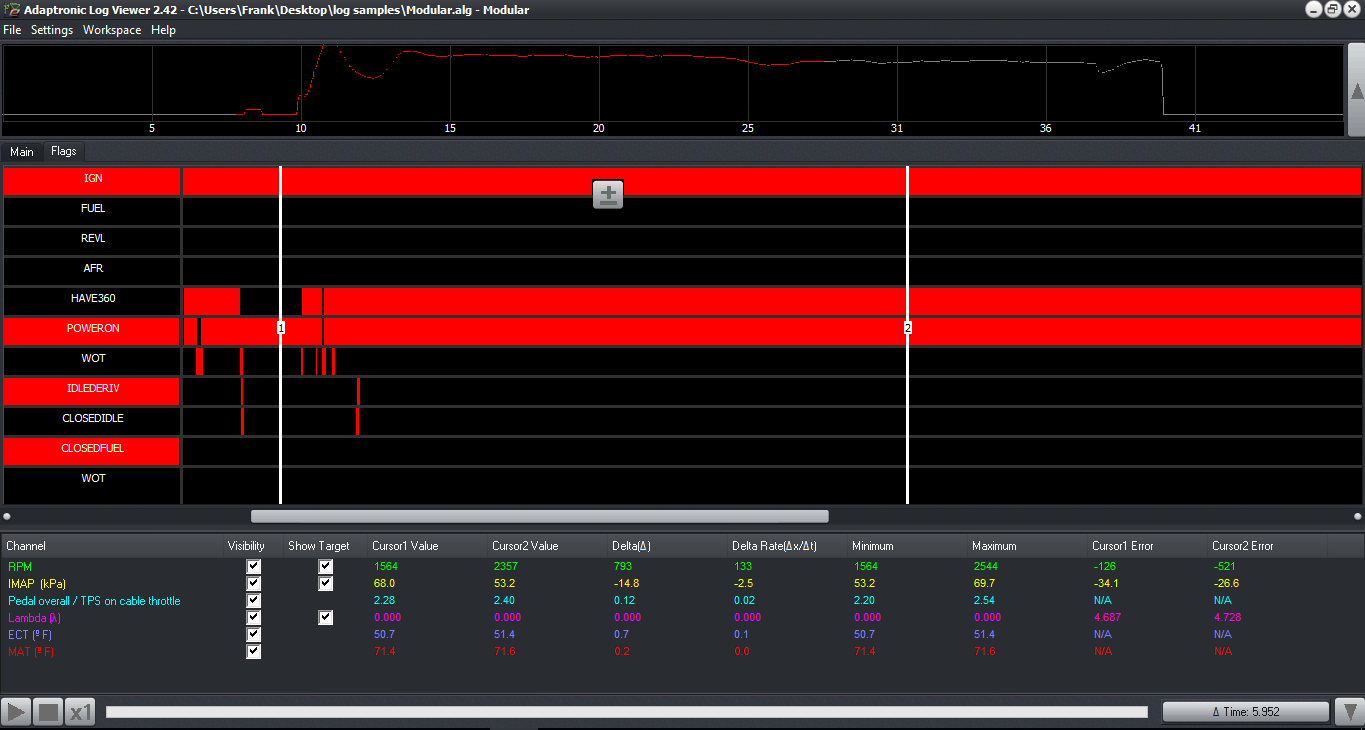
- Only Cursor 1 is used in flag selection. The background color of the graph row label becomes red if the flag is active when the cursor is over it. Parameters at the bottom are displayed as usual. Cursor 2 does not detect of a flag is active or not, but still shows the associated values in the bottom panel.
- Navigation in this tab is much like main panel navigation. In fact, you can just switch tabs since the displayed time interval is the same.
- The flag tab is only available for Modular ALG logs only. Not all flags are available in internal logs (only the ones under FLAGSH and FLAGSL are logged every time internally by default).
The Channel and Flag Selection Screens:
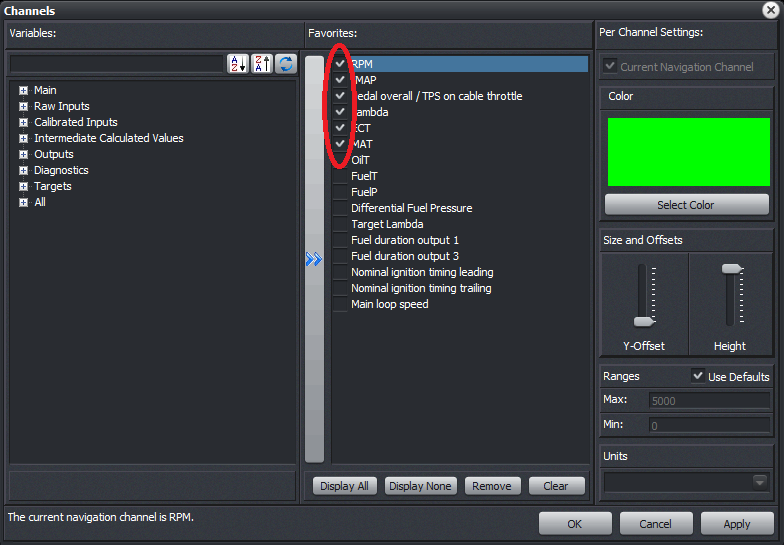
- The left pane shows all the channels that have been logged in tree form. Searching for a specific parameter works too. Simply type on the text box and the tree will expand to suit.
- Clicking the >> button or double clicking the parameter will transfer it to the right pane, making it a favorite.
- What are favorites?
- These are parameters which are saved and flagged as ones to be loaded into memory for later viewing. With 1024 channels, and a VERY long log, not loading everything will save file opening times. This is useful for opening files over a network, etc.
- Checked channels in the right pane will select it for viewing.
- To set the navigation parameter to use, simply click "Use as Navigation Channel" with the channel selected. The default is RPM.
- Channel graphing color, Custom minimum, maximum (graph range)m Y-offset and Graph Height is saved per channel.
- Units are saved globally, meaning setting it to °F will convert, graph and display all temperature logs in that unit.
- The Flag Selection screen has the same structure, but does not have per channel settings.
Keyboard Shortcuts:
- Left Arrow Key - Pan Graph to the left.
- Right Arrow Key - Pan Graph to the right.
- Up Arrow Key - Toggle navigation bar.
- Down Arrow Key - Toggle data table.
- Page Up - Zoom to area between cursors.
- Page Down - Zoom out.
©2018 Adaptronic