How to Use Tables and Graphs

X and Y axes of the table may have different data types depending on which settings you're working on.. For example if you're working on a fuel map, X-axis has the RPM data type while the Y-axis has either MAP or TPS, depending on your load selection setup.
1. To start setting up the X-axis, right-click on the table (or graph) and choose 'Change X-axis step size' from the pop-out menu. The axis configuration window will pop out.
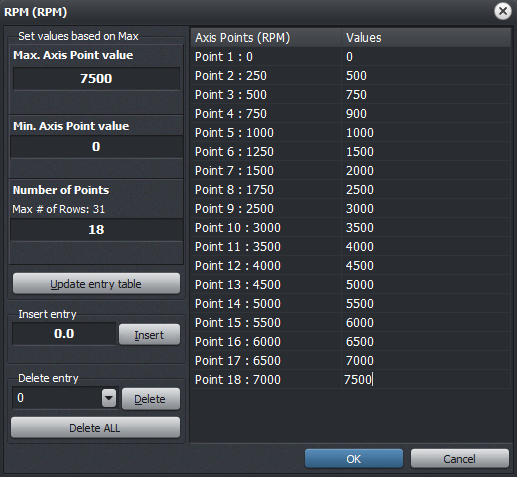
2. You should be able to insert and delete entry points in the axis range, or set the maximum axis value and Eugene will work out each interval in the series. This fills out the maximum number of columns for X-axis (or rows for Y-axis).
3. Once everything is set, click OK. If an error is detected (e.g. duplicate netries, etc), fix the entry value and hit OK again.
Back to top
Inserting cells
Inserting a row or column is easy!
1. Click on the table to select a cell.
2. Hit INSERT key to insert a column (or SHIFT + INSERT to insert a row).
3. A window will pop out to ask for the Column (or row) header value. The default value is usually the average between the activell cell column and the column to the right (or the active cell row and the row below).
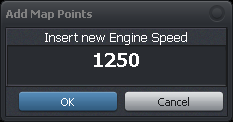
4. Hit OK when finished.
Back to top
Deleting cells
Deleting cells are much easier! Unlike inserting cells, you can delete multiple columns or rows at one time.
1. Click (and drag) to selec the columns or rows to be deleted.
2. Hit DELETE key to delete columns (or SHIFT + DELETE to delete rows). A prompt window will pop out for the confirmation.
3. Hit YES to confirm.
Back to top
Selecting Cells
Navigating through the cells can be done by using mouse or arrow keys.
- To select multiple cells, simply select the starting cell and then hold down SHIFT key while using the arrow keys. When using a mouse, simply drag while pressing left-mouse button.
- Selecting the entire column or row is done using a mouse by clicking on the header. To select multiple columns or rows, just drag from the initial header while pressing left-muse button.
Data Entry
Only these are valid entries in data tables
- Numbers 0-9
- Decimal point ( . )
- Negative sign (
- )
Tips:
a. To invalidate an entry, press ESCAPE key to revert to previous cell value
b. To increment / decrement the cell's value, press PAGE UP or PAGE DOWN. When pressed while holding CTRL key down, the increment or decrement is the tenth of the default increment value
Back to top
Interpolation
Use the interpolation function to blend parts of the map. There are 3 ways to do it:
1. Interpolate from Corner
a. Select group of cells (at least 3x3) in the table. To select all cells, press W (Select All).
b. Press L to start interpolation
2. Interpolate Columns
a. Select group of cells (at least 3 cells in a column) in the table. To select all cells, press W (Select All).
b. Press Y to start interpolation
3. Interpolate Rows
a. Select group of cells (at least 3 cells in a row) in the table. To select all cells, press W (Select All).
b. Press X to start interpolation
Back to top
Duplicating Cell Value a.k.a Copy/Paste
There are two ways to do it
1. Conventional Copy and Paste
a. Select a cell or group of cells to be copied and then press CTRL + C.
b. Click on the cell where you want those values to be copied and then press CTRL + V.
Note: If the size of the copied cells is 3x3 for example, it will be pasted to a 3x3 cell area as well.
2. Speed Copy - this mode copies the active cell value to its adjacent cell. This mode needs to be activated though by pressing D.
a. Copy single cell - click on the cell that will be copied, and then press CTRL + ARROW keys to start copying.
b. Copy entire column - click on the column header, and then press CTRL + LEFT/RIGHT ARROW key to start copying.
c. Copy entrire row - click on the row header, and then press CTRL + UP/DOWN ARROW key to start copying.
Back to top
Map Trace
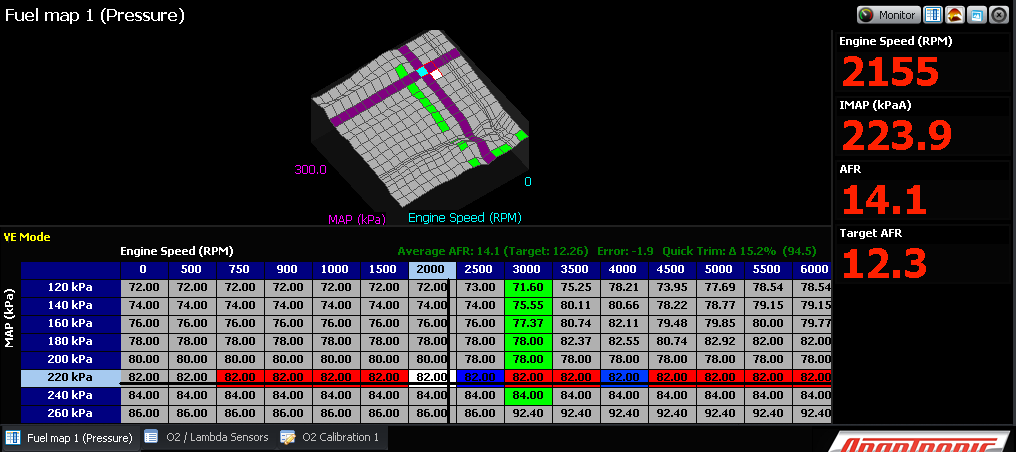
This function is only available when an ECU is connected and Eugene is reading gauge data out of the ECU. When this happens, the cross hair in the table will be shown, displaying the the axes' live data values from the ECU. Map trace function basically just maps out the cells that were previously active based on the axes' live data.
When this function is enabled (by pressing T), the active cells (both previous and current) are highlighted in color RED, except for fuel map tables which highlights are based on the leanness/richness of the average AFR vs. the target AFR.
Back to top
Cell Tagging
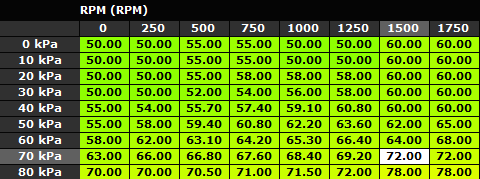
When working with fuel maps, a cell can be tagged as "Tuned" or "Untuned".
1. Select cells to be marked, either by using a mouse or by arrow keys.
2. Press M to mark cells as 'Tuned" or press U to mark cells as "Untuned".
3. Tuned-marked cells will have a green font color to be distinguished among the rest.
Back to top
©2018 Adaptronic