
Page 22 - TransportationPlanUsetsGuide
P. 22
Travel Demand in Washington County
The growth envisioned in the population and employment forecasts translates directly into transportation system needs
within Washington County. Of particular significance for the transportation system is the growth in jobs and peak-hour
travel demand. Travel most often occurs to, from, or between areas of employment. Population numbers are an impor-
tant indication of the number of travelers, but employment has a greater impact on where travelers want to go. There
was limited growth in traffic between 2007 and 2012, which corresponds with the economic downturn that resulted in
the loss of more than 50,000 jobs in Washington County between 2005 and 2010. During that same time population
increased by almost 43,000 people.
Washington County estimates existing and future travel demand using a specific west side version of the regional travel
demand model. The regional forecasting model is calibrated with a number of inputs, including household activity
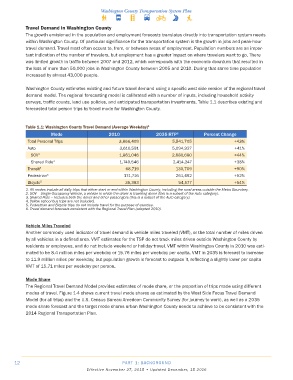
surveys, traffic counts, land use policies, and anticipated transportation investments. Table 1.1 describes existing and
forecasted total person trips by travel mode for Washington County.
Table 1�1: Washington County Travel Demand (Average Weekday) 1
Mode 2010 2035 RTP 6 Percent Change
Total Personal Trips 3,866,409 5,541,705 +43%
Auto 3,610,591 5,094,927 +41%
SOV 2 1,861,046 2,680,680 +44%
Shared Ride 3 1,749,546 2,414,247 +38%
Transit 4 68,719 130,709 +90%
Pedestrian 5 171,716 261,492 +52%
Bicycle 5 35,383 54,577 +54%
1. All modes include all daily trips that either start or end within Washington County, including the rural areas outside the Metro Boundary.
2. SOV – Single Occupancy Vehicle, a vehicle in which the driver is traveling alone (this is a subset of the Auto category).
3. Shared Ride – Includes both the driver and other passengers (this is a subset of the Auto category).
4. Yellow school bus trips are not included.
5. Pedestrian and Bicycle trips do not include travel for the purpose of exercise.
6. Travel demand forecasts consistent with the Regional Travel Plan (adopted 2010).
Vehicle Miles Traveled
Another commonly used indicator of travel demand is vehicle miles traveled (VMT), or the total number of miles driven
by all vehicles in a defined area. VMT estimates for the TSP do not track miles driven outside Washington County by
residents or employees, and do not include weekend or holiday travel. VMT within Washington County in 2010 was esti-
mated to be 8.4 million miles per weekday or 15.76 miles per weekday per capita. VMT in 2035 is forecast to increase
to 11.9 million miles per weekday, but population growth is forecast to outpace it, reflecting a slightly lower per capita
VMT of 15.71 miles per weekday per person.
Mode Share
The Regional Travel Demand Model provides estimates of mode share, or the proportion of trips made using different
modes of travel. Figure 1-4 shows current travel mode shares as estimated by the West Side Focus Travel Demand
Model (for all trips) and the U.S. Census Bureau American Community Survey (for journey to work), as well as a 2035
mode share forecast and the target mode shares urban Washington County needs to achieve to be consistent with the
2014 Regional Transportation Plan.
12 PART 1: BACKGROUND
Effective November 27, 2015 • Updated December, 15 2016