
Follow us on Twitter: Follow @IdarMethod Related topics: Fountains: A Better Agile Way We are Neglecting Software Design
What is IDAR? It’s a better way of designing software and of graphing designs. IDAR makes designs so clear that they resist the usual slide into messiness that wastes your time. And their vivid clarity helps you to notice bugs before they are coded, saving even more of your time. Here are free articles about IDAR:
| The definitive description of the IDAR method (and IDAR graphs) is this $25 book (365 pages) written by Mark A. Overton, the inventor of IDAR graphs. The two articles contain enough information to get you started. But if you wish to learn the many |
 |
Scroll down to read the second article...
Last updated: April 7, 2018
IDAR graphs are a more understandable way of portraying the designs of object-oriented software than UML. In fact, and this is surprising, IDAR graphs are the only effective way we have of portraying how software operates. In addition, this graphing technique is upheld by four rules governing design. Those rules, plus some additional criteria for gauging the goodness of designs, changes software development from an art into a proper field of engineering. That’s a strong statement, but I justify it below.
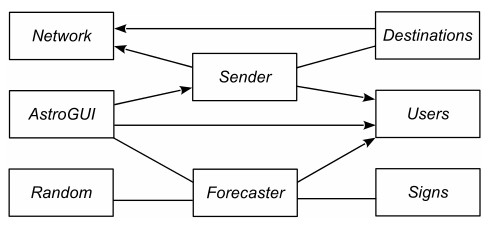
The UML diagram above is for an astrology application. The lines between classes indicate which classes know about each other. An arrowhead indicates that the knowledge is one-way. Based on this diagram, do you understand how this software operates? Me neither. For example, which object controls all this? You don’t know. Which objects are managers versus workers? You don’t know. This diagram fails to convey what you need to know most: the hierarchy of control.
Imagine trying to portray the structure of a corporation by drawing a line between every pair of employees who talk to each other. Such a talks-to diagram would rapidly become incomprehensible spaghetti like this:
Real-life UML class- and communication-diagrams for large programs actually look like this because they show all talks-to relationships. What a mess! Talks-to diagrams are useless.
Instead of the talks-to spaghetti that UML provides, people need to see an organization such as a corporation expressed as a hierarchy of command, with the highest manager at the top, down through lower layers of management, and with the workers at the bottom. This approach also works well with software.
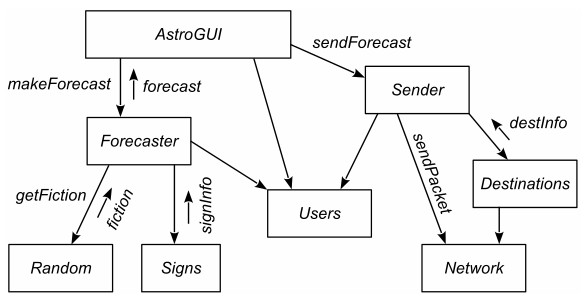
This IDAR graph portrays the same astrology application as seen earlier, but now you can see the levels of control in it. A downward arrow connecting two boxes (objects) means that the upper object commands the lower one, forming a superior-subordinate relationship, like a boss and a worker. A floating arrow represents secondary communications between objects called “notices”. Commands and notices are merely method-calls, and are usually labeled by their arrows.
In this graph, you see that AstroGUI is the top-level controller, and that Forecaster commands Random to getFiction (i.e., Forecaster calls a command-method in Random named getFiction). The fiction is returned to Forecaster in the fiction notice. UML told you none of this. IDAR graphs are much more informative than UML diagrams.
Object-oriented programming (OOP) has a feature called “inheritance” which creates an attractive hierarchy in UML. Unfortunately, this is a hierarchy of categories, which is of little use. For example, an inheritance hierarchy could show that a Fan is in the Device category (superclass). But that doesn’t help you because you need to know which objects control the Fan. IDAR provides a hierarchy of control, which is what humans need.
It’s important to remember that commands and notices are methods. Therefore, an object commands another object by calling a command (method) in the target object. In other words, the way you command another object to do something is by calling a command (method) in it. Likewise, an object notifies another by calling a notice (method) in it.
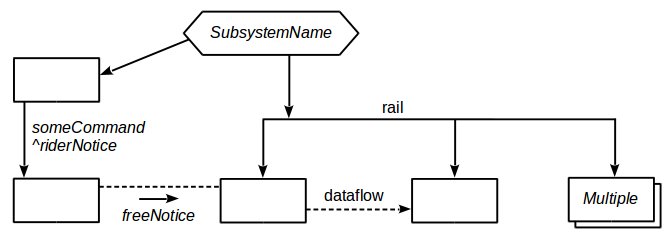
These four rules form the foundation of IDAR, but there are additional rules about drawing IDAR graphs. For example, an elongated hexagon denotes a subsystem, a dashed arrow denotes a dataflow, and a horizontal line (called a “rail”) is used to group subordinates under one or more superiors, analogously to a corporate organizational chart. A “free notice” is one that does not follow a command-arrow. On the graph, first draw a dummy dashed line (with no arrowhead) connecting the two objects, and then draw the free notice’s floating arrow next to it. Also, a notice can be carried back on a method-return of a command as its function-value or via a changed parameter. Such a “rider notice” is not drawn with a floating arrow, but is labeled next to the command-label with a caret followed by its name, as in ^result. Finally, a class that produces multiple instances is drawn as a stack of boxes labeled with the class name, such as Multiple in the figure below, which illustrates these additional features of IDAR graphs.
IDAR graphs impart several benefits, but the most important are ease of understanding and resistance to messiness. These graphs are easier to understand than UML for several reasons:
IDAR graphs resist the natural tendency toward messiness because the four rules provide reasonable constraints on what developers can do. They are not allowed to create spaghetti by calling anything from anywhere. UML provides no defenses against spaghetti-structure.
Surprisingly, imposing these rules makes design easier, instead of harder as you would expect. The rules provide guidance. They require that you have a topmost controller, so that object is obvious. The hierarchy forces you to have bottom level objects, and they are usually obvious as well because they interact with the outside world or contain detailed algorithms. With these top level and bottom level objects anchoring the graph, it’s easier to define the objects between them. UML provides none of this guidance.
IDAR graphs have been employed in a medium-size pilot project at the Northrop Grumman company, and in a variety of life-size trial programs, assuring us that they are both practical and sufficiently flexible.
Art is primarily subjective, with no rules that ensure the artwork will be good. Some heuristic rules are available to the artist which provide assistance, such as matching colors, balance, and not touching the sides and corners of the canvas. Likewise, a software developer is given some heuristic rules, commonly expressed as “smells”. Such rules help avoid creating bad designs, but don’t ensure that designs are good.
On the other hand, a field of engineering employs “design rules” to ensure that the resulting design will be reasonable, meaning that it will work and not be wasteful. For example, there are rules for electrical engineers about placement and lengths of traces on circuit boards. UML and smells provide no analogous way of ensuring that a software design will be reasonable.
Fortunately, IDAR provides the four rules which eliminate messy aspects of designs, and ensure that every design consists of a hierarchy of roles, with the broad roles at the top and narrowest at the bottom. Furthermore, IDAR offers the following criteria for evaluating the quality of a design:
Although these quality-criteria are partly subjective, they can be assessed as good/medium/poor/unacceptable with decent consistency from person to person. When the four rules are combined with these criteria, we are assured of creating a reasonable design, changing software design from an art into a proper field of engineering. IDAR causes “software engineering” to no longer be an oxymoron.