Usage Trends
|
|
|
Usage Trending displays the cloud services historical as well as projected data usage which can be displayed by license Count or Cost.
|
Service |
|
|
Microsoft Office 365 |
|
|
Google Apps |
|
Click on the Cost or Count button to alternate between the displayed dataset.
Cost: Microsoft Office 365
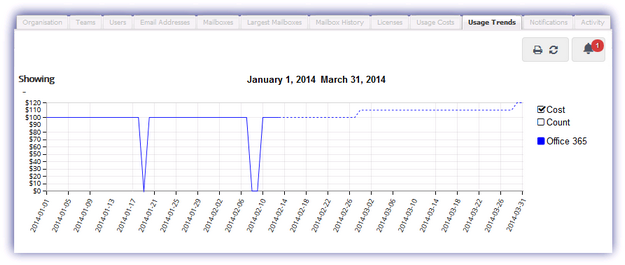
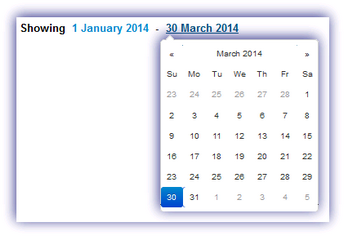
To remove or add cloud service information toggle the relevant name button whilst the chart date range is specified by clicking on the chart start or end date.
Please note, the Cost per User used for the Cost calculation for Microsoft Office 365 and Google Apps is entered when initially setting up the service and may be amended post-integration through the Edit Service dialog in the Services drop-down.
The following option is available for this section.
|
Icon |
Option |
|
|
|
|
Opens the Users tab of the Dashboard in a new window ready for printing |
|
|
Refresh |
Click to refresh the data in the selected tab |
|
|
Alert |
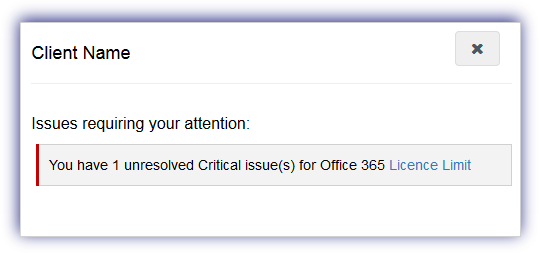
The notification alert button provides a visual indicator of the number of issues currently affecting the service requiring your attention and is based on the current highest severity level. Click the alert button to display information on all of the unresolved problems of this severity type and select the issue link to open the Notifications tab focused on these specific messages. Once finished in the notification alert dialog select X to close. Please note that the notification alert reflects the current highest level of severity. For example if the notification alert displays one critical issue, after resolving this issue any warning level messages are then displayed.
|