Model Metrics
The Model Metrics pane enables you to see a summary
of metric measurements showing how your Revit models are built. Clarity
provides a variety of mechanisms to capture individual metrics on each
Revit model.
These include:
- File Size / File Open Time (Which can be a measurement
of cleanliness/health/complexity)
- Modeling Practices (Such as # of Warnings, CAD Imports,
In Place Families or Groups)
- Cleanup (# of Views Not on Sheets, Purgeable Families)
- Performance (Autodesk provides 18 criteria for why
your Revit model is slow – for example, large families).
- Complexity (# of Views, Sheets, Room/Space/Floor
Area, Worksets)
Summary Tab
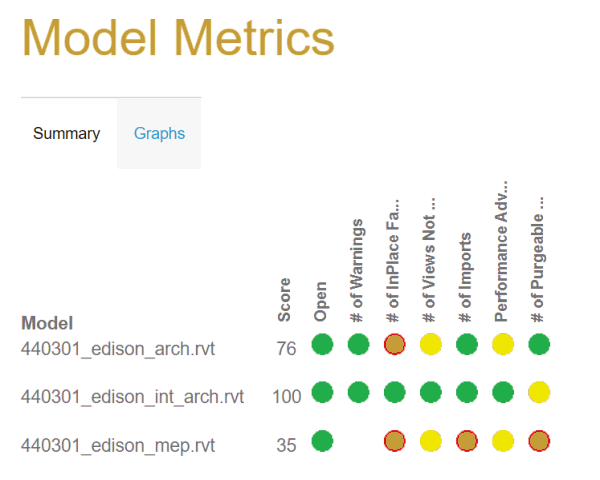
The Summary
tab displays all of the models that have been processed with metric
data and the most recent values for each of the
Firm Standard Metrics that the administrator has defined. The
existing red, yellow, green icons represent a range defined at the company
level for what the expected range should be. This is useful in drawing
the attention to those models and metrics that require work.

The metrics shown are the subset of metrics that your
firm has decided are important to focus on. If your firm has implemented
scoring for models, you will also see a "Model Score".
Graphs Tab
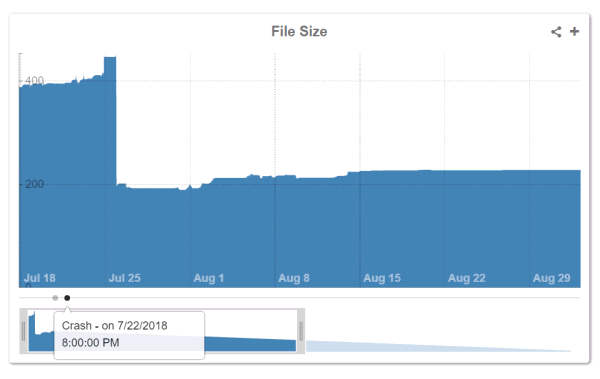
The Graphs
tab enables you to look at the history of a variety of metrics over time,
and to add various dashboard items to track values and trends.
Notes:
- From the available drop-down lists, you can select
the model that you want to check and the metrics required.
- Metrics such as Model
Size (and Support File Size
for Revit Server Projects)
always display. You can choose which additional metric you want to
see graphed over time.
- To focus in on a particular area of time on the
graph, move the handles below the graph to a specific area within
the timespan.
- Many of these metrics require the Model
Metrics or Performance
Advisor tasks to be setup in order to collect the metrics.
- The Ranges
page (in the Metrics area)
enables you to compare between models or across multiple Projects.
- Any Model Events that have been reported show up
as dots along the bottom of the graph.

Dashboard
To keep track on a specific metric, click the +
in the upper right corner of the graph to add a dashboard widget at the
top of the screen. This enables you to instantly track that metric for
that model and see its value and what the change is compared to a previous
metric value.

For more details on the various metrics that Clarity
can capture, see Model
Metrics Overview and Firm
Standards.
IMAGINiT
Clarity
Copyright © 2011-2020, Rand Worldwide, Inc. All Rights Reserved
