Monitoring Protected Virtual Machines – The VMs Tab
View details of the protected VMs in the VMs tab.
This tab lists all the protected virtual machines from both the local and remote sites and provides summary details of each virtual machine.

You can filter information in columns via the filter icon next to each column title. You can also sort the list by each column.
GENERAL View
The following information is displayed in the GENERAL view:
|
•
|
Alert status indicator: The color indicates the status of the VPG: |
|
•
|
Green: The VPG is being replicated, including syncing the VPG between the sites. |
|
•
|
Orange: The VPG is being replicated but there are problems, such as an RPO value larger than the Target RPO Alert value specified for the VPG. |
|
•
|
Red: The VPG is not being replicated, for example, because communication with the remote site is down. |
|
•
|
VM Name: The name of the virtual machine. The name is a link. |
|
•
|
VPG Name: The name of the VPG. The name is a link: Click the VPG name to drill-down to more specific details about the VPG that are displayed in a dynamic tab. |
|
•
|
Direction: The direction of the replication, from this site to the remote site or from the remote site to this site. |
|
•
|
Peer Site: The name of the site with which this site is paired: the site where the VPG is protected or will be recovered to. |
|
•
|
Priority: The priority of the VPG. |
|
•
|
Protection Status: The current status of the virtual machine, such as Meeting SLA. Where appropriate, the percentage of the operation completed, such as syncing, is displayed. |
|
•
|
State: The current substatus of the VPG, such as Delta syncing. Where appropriate, the percentage of the operation completed, such as syncing, is displayed. |
|
•
|
Actual RPO: The time since the last checkpoint was written to the journal. This should be less than the Target RPO Alert value specified for the VPG. |
|
•
|
Operation: The operation, such as Move, that is currently being performed. |
PERFORMANCE View
The following information is displayed in the PERFORMANCE view:
|
•
|
IO: The IO per second between all the applications running on the virtual machine and the VRA that sends a copy to AWS. |
|
•
|
Throughput: The MB per second for all the applications running on the virtual machines being protected. There can be a high IO rate with lots of small writes resulting in a small throughput as well as a small IO with a large throughput. Thus, both the IOPS and Throughput values together provide a more accurate indication of performance. |
|
•
|
Network: The amount of WAN traffic. |
Provisioned Storage: The provisioned storage for the virtual machine in the recovery site. Thus, a virtual machine with 1GB hard disk and 4GB memory will show 5GB provisioned storage.
Used Storage: The storage used by the virtual machine in the recovery site.
RETENTION STATUS View
The following information is displayed in the RETENTION STATUS view:
|
•
|
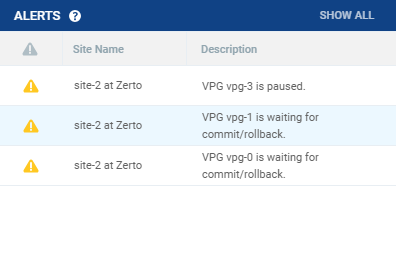
Alert status indicator: The color indicates the status of the VPG. Clicking the alert displays a popup of all active alerts with descriptions: |
|
•
|
Green: The VPG is being replicated, including syncing the VPG between the sites. |
|
•
|
Orange: The VPG is being replicated but there are problems, such as an RPO value larger than the Target RPO Alert value specified for the VPG. |
|
•
|
Red: The VPG is not being replicated, for example, because communication with the remote site is down. |
|
•
|
VPG Name (#VMs): The name of the VPG. The name is a link: Click the VPG name to drill-down to more specific details about the VPG that are displayed in a dynamic tab. |
|
•
|
Retention Policy: Whether the VPG is protected against a disaster only with the ability to recover to a point in time up to 30 days before the disaster, or protection is extended to include retention sets of the virtual machines, going back for a maximum of one year. |
|
•
|
Retention Policy Status: The status of the retention set. |
|
•
|
Repository Name: The Repository that is currently configured for the VPG. |
|
•
|
Restore Point Range: The restore points for the retention job out of the total retention jobs run for the VPG. |
|
•
|
Retention Policy Scheduling: The schedule for the retention process. |
Additional Fields
In the GENERAL and PERFORMANCE views you can:
|
•
|
Show/Hide Columns, Create View and Reset Columns using the settings ( ) menu. ) menu. |
|
•
|
Sort the list by a column by clicking in the column title. |
|
•
|
Filter information in the columns by clicking the filter button ( ) that is displayed when the mouse cursor is moved into the column title. Active filters are displayed with a yellow background. ) that is displayed when the mouse cursor is moved into the column title. Active filters are displayed with a yellow background. |
See also: